Suspected Sick Report
Healthy animals display stable
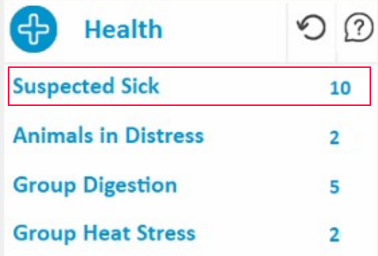
Click Suspected Sick report to view the animals affected by an undefined issue, and as a prompt to investigate the animal's wellness.
Understand the Non-Specific Health Report
Animals are entered into the report when their eating and/or rumination behaviors deviate from their normal behaviors identifying them as potentially sick.
Note: The report automatically includes milk, dry cows and heifers. However, the parameters can be changed to include only milk cows.
|
Column |
Description |
|---|---|
|
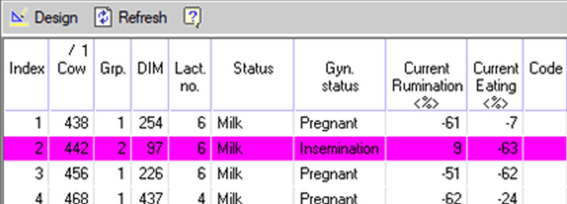
Current Rumination (%) |
Displays (in percentage) deviations in the animal's rumination time, compared to her normal rumination time for the same time of day. |
|
Current Eating % |
Displays (in percentage) deviations in the animal's eating time, compared to her normal eating time for the same time of day. |
Understand the Graph
Click a specific row in the Detailed Report to open the animal's behavior deviations for the last 3 days, in a graph view.
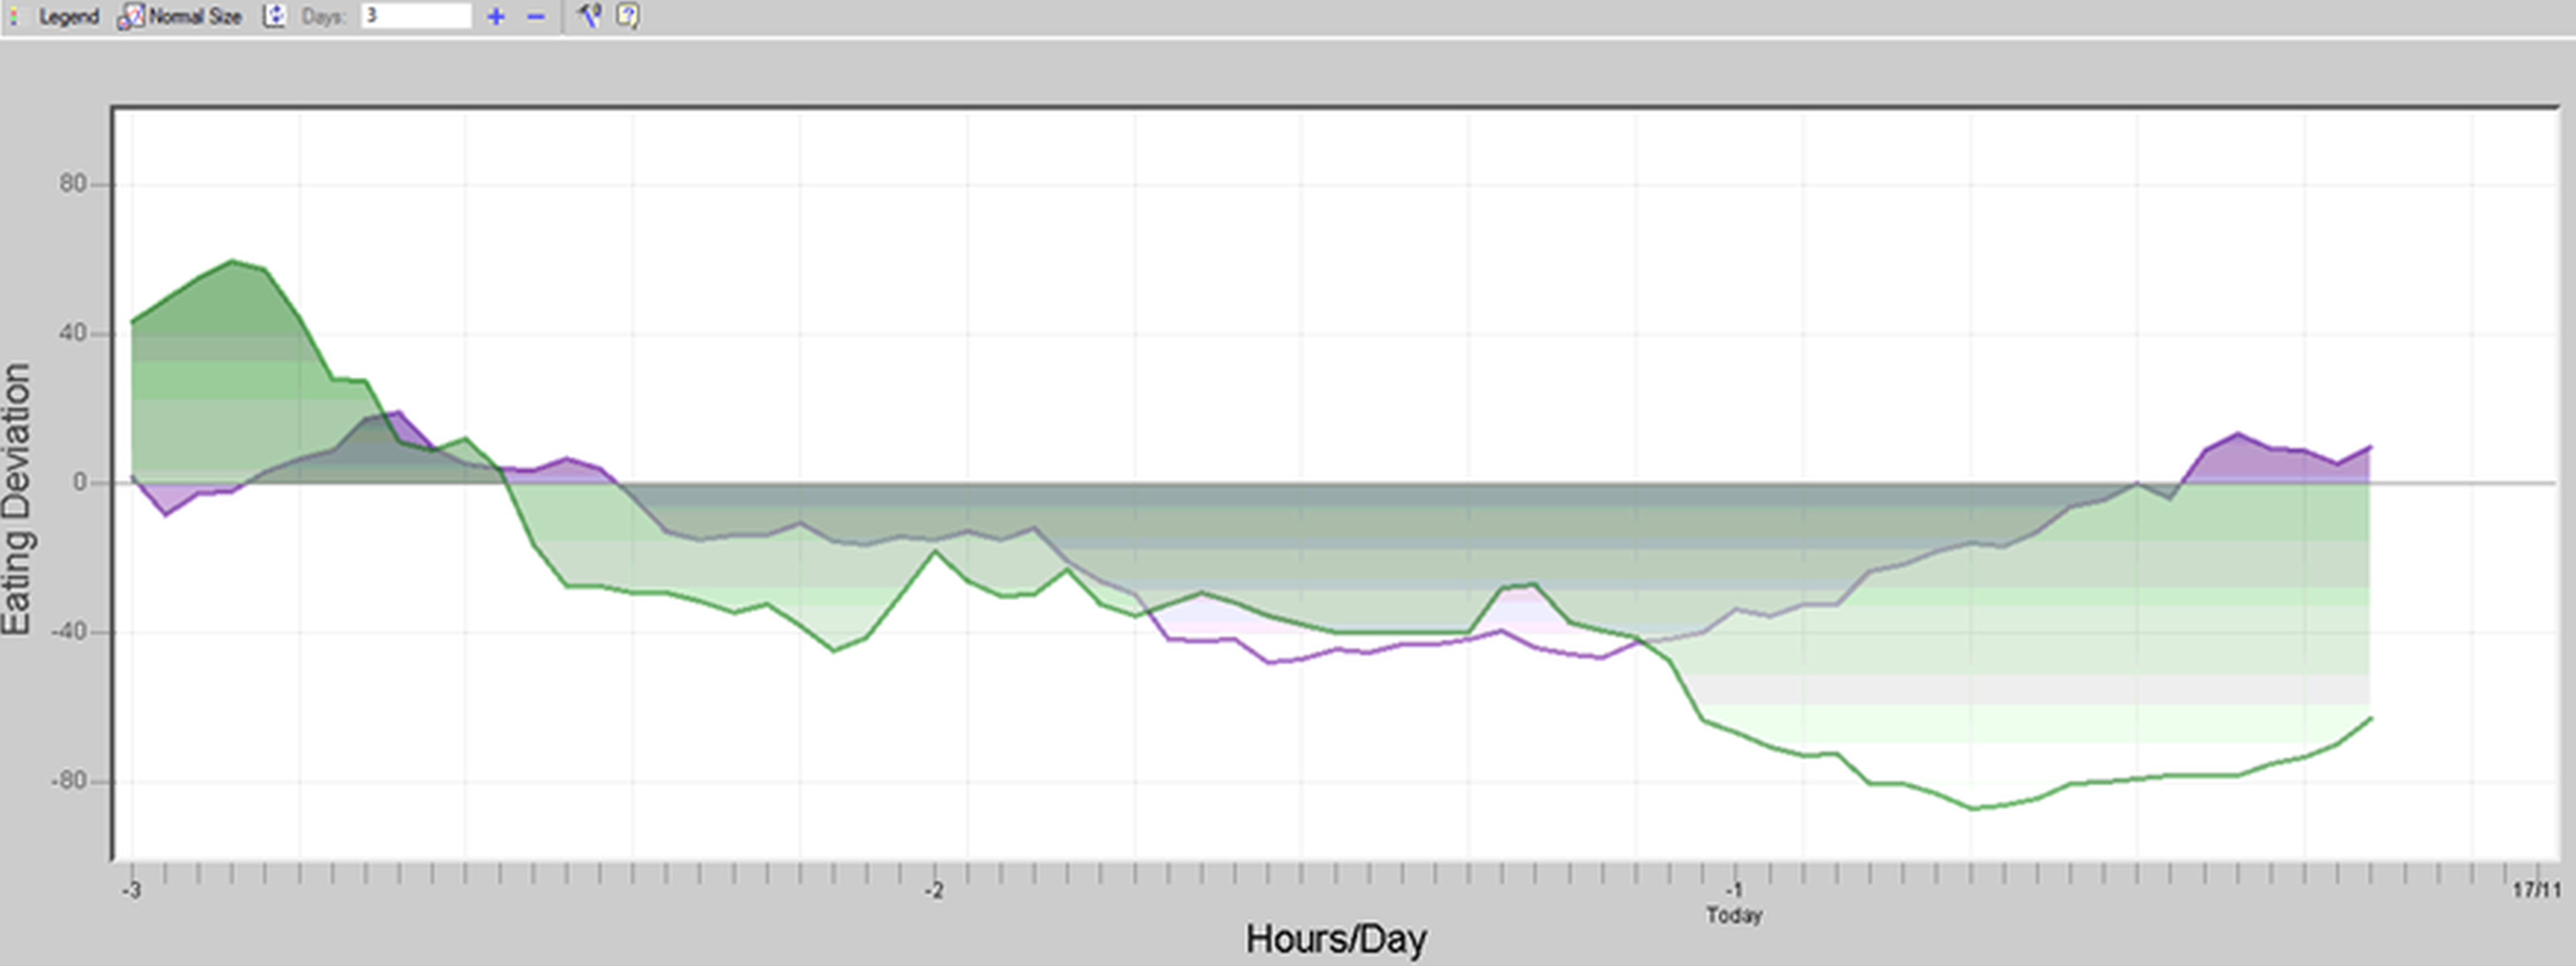
Note: On the Activity Indicator axis, 0 represents average standard eating, rumination and activity behavior for the specific animal. Graph legends above 0 indicate above average amount of time spent eating/ruminating/activity, while graph legends that dip below 0 indicate a decrease in the average amount of time spent on the behavior.
The example below indicates a significant and sudden decrease in the cow's rumination and eating times. This suggests a health issue exists.
-
Purple Legend – Accumulated daily rumination time. The example below indicates a consistent deviation over the last 2.5 days.
-
Green Legend – Accumulated daily eating time. The example below shows a consistent deviation over the last 2.5 days.
Healthy animals display stable
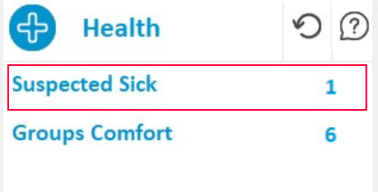
Click Sick Behavior to view the animals affected by an undefined issue, and as a prompt to investigate the animal's wellness.
Understand the Non-Specific Health Report
Animals are entered into the Non-Specific Health report when their activity and/or rest time behaviors deviate from their normal behaviors identifying them as potentially sick.
Note: The report automatically includes milk, dry cows and heifers. However, the parameters can be changed to include only milk cows.
In the example, cow 9010 was entered into the report for showing increased rest and lower activity compared to her normal behavior. This suggests she is not feeling well and should be checked.
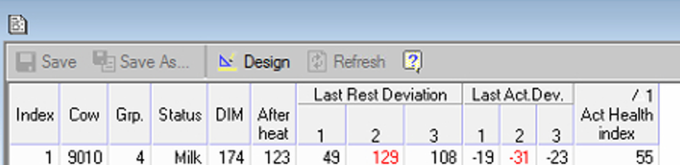
The table displays, in red, deviations to the cow's rest and activity behavior that exceed set thresholds. It also displays a health score (100 = excellent comfort conditions). Penalty points are deducted for rest and activity behavior.
|
Column |
Description |
|---|---|
|
Last Rest Deviation |
Displays the cow's percentage rest deviation for the past sessions compared to her 10 average for the same sessions. |
|
Last Activity Deviation |
Displays the cow's activity deviations or the past sessions compared to her 10 average for the same sessions. |