View Daily Milk Quality
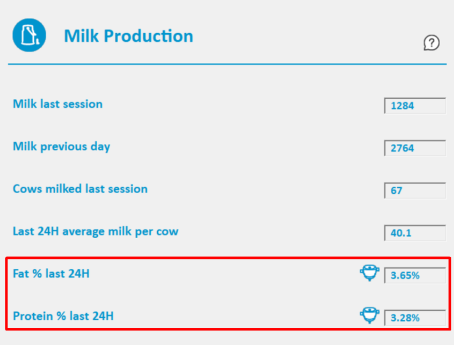
Farms with AfiLab can monitor the average fat% and protein% per cow – as displayed on the ABC dashboard.
Click either Fat % last 24H or Protein % last 24H to open the Groups Fat & Protein Production report.
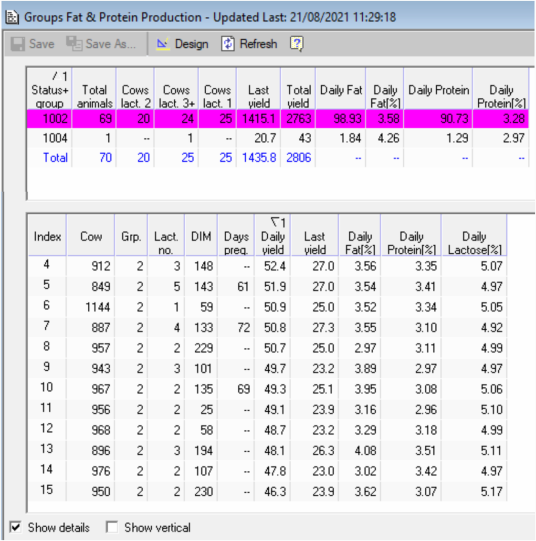
The top table displays the total daily fat and protein productivity as a quantity, and as a percentage of total yield.
|
Column |
Description |
|---|---|
|
Total animals |
Total number of animals in the group |
|
Cows lact 2, 3+, 1 |
Total number of second, third +, and first lactation cows in the group |
|
Last yield |
Total yield of identified cows in the last session |
|
Total yield |
Total yield of the group over the last 24 hours |
|
Daily Fat |
Total fat (in kg) per group in the last 24 hours |
|
Daily Fat % |
Average fat % per group for the last 24 hours |
|
Daily Protein |
Total protein (in kg) per group in the last 24 hours |
|
Daily Protein % |
Average protein % per group for the last 24 hours |
Click a row in the top table to view the quality and yield of each cow in the group. The bottom table includes the following additional columns:
|
Column |
Description |
|---|---|
|
Days preg |
Number of days confirmed pregnant |
|
Daily yield |
Cow's milk production for the completed milking sessions in the last 24 hours |
|
Daily Lactose |
Cow's average lactose % for the last 24 hours |