Fresh Cows to Check Report
Fresh cows (5 to 30 DIM) are supposed to increase production after calving. Cows that fail to increase production as expected are likely suffering from a common calving disease.
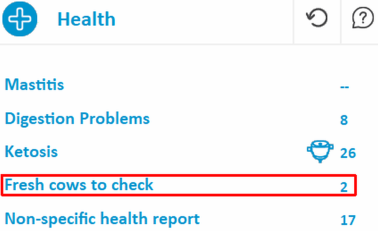
Click Fresh cows to check on the dashboard to open the associated report.

The table lists all fresh cows whose yields have not increased according to expectation and are therefore suspected of suffering a calving disease. The report is refreshed every hour.
In the report shown, both cows were entered because their yield for the last 24 hours dropped comparatively to their average yield. During this time their yields should have been at an increase.

|
Column |
Description |
|---|---|
|
Cow |
Displays cow number. |
|
Grp |
Displays cow group number. |
|
Gyn. status |
All cows in the report belong to the "Fresh" status, since the report alerts to potential calving diseases. |
|
Lact no |
Displays the cow's lactation number. |
|
DIM |
Displays the number of days in milk (or days since calving). Calving disease occurs soon after calving. Cow's yield is supposed to increase according to her number of DIM. |
|
Yield Last 24H |
Displays the cow's total milk production in the last 24 hours. |
|
Daily avg yield |
Displays the cow's daily average yield for the last 10 days. |
|
Yield Last 24H% |
Displays the % change in yield for the last 24 hours compared to her average daily yield. The report is filtered to list with the highest milk decrease first. Significant drops in yield, or a failure to increase, may be signs of a calving disease. |
|
Production Rate % |
Displays the % deviation in production rate changes for the last completed sessions compared to the cow's 10-day average production rates for the same sessions. |
|
Conductivity % |
Displays the cow's milk conductivity deviation in the last completed sessions, compared to her average conductivity for the same sessions. |
Understand the graph
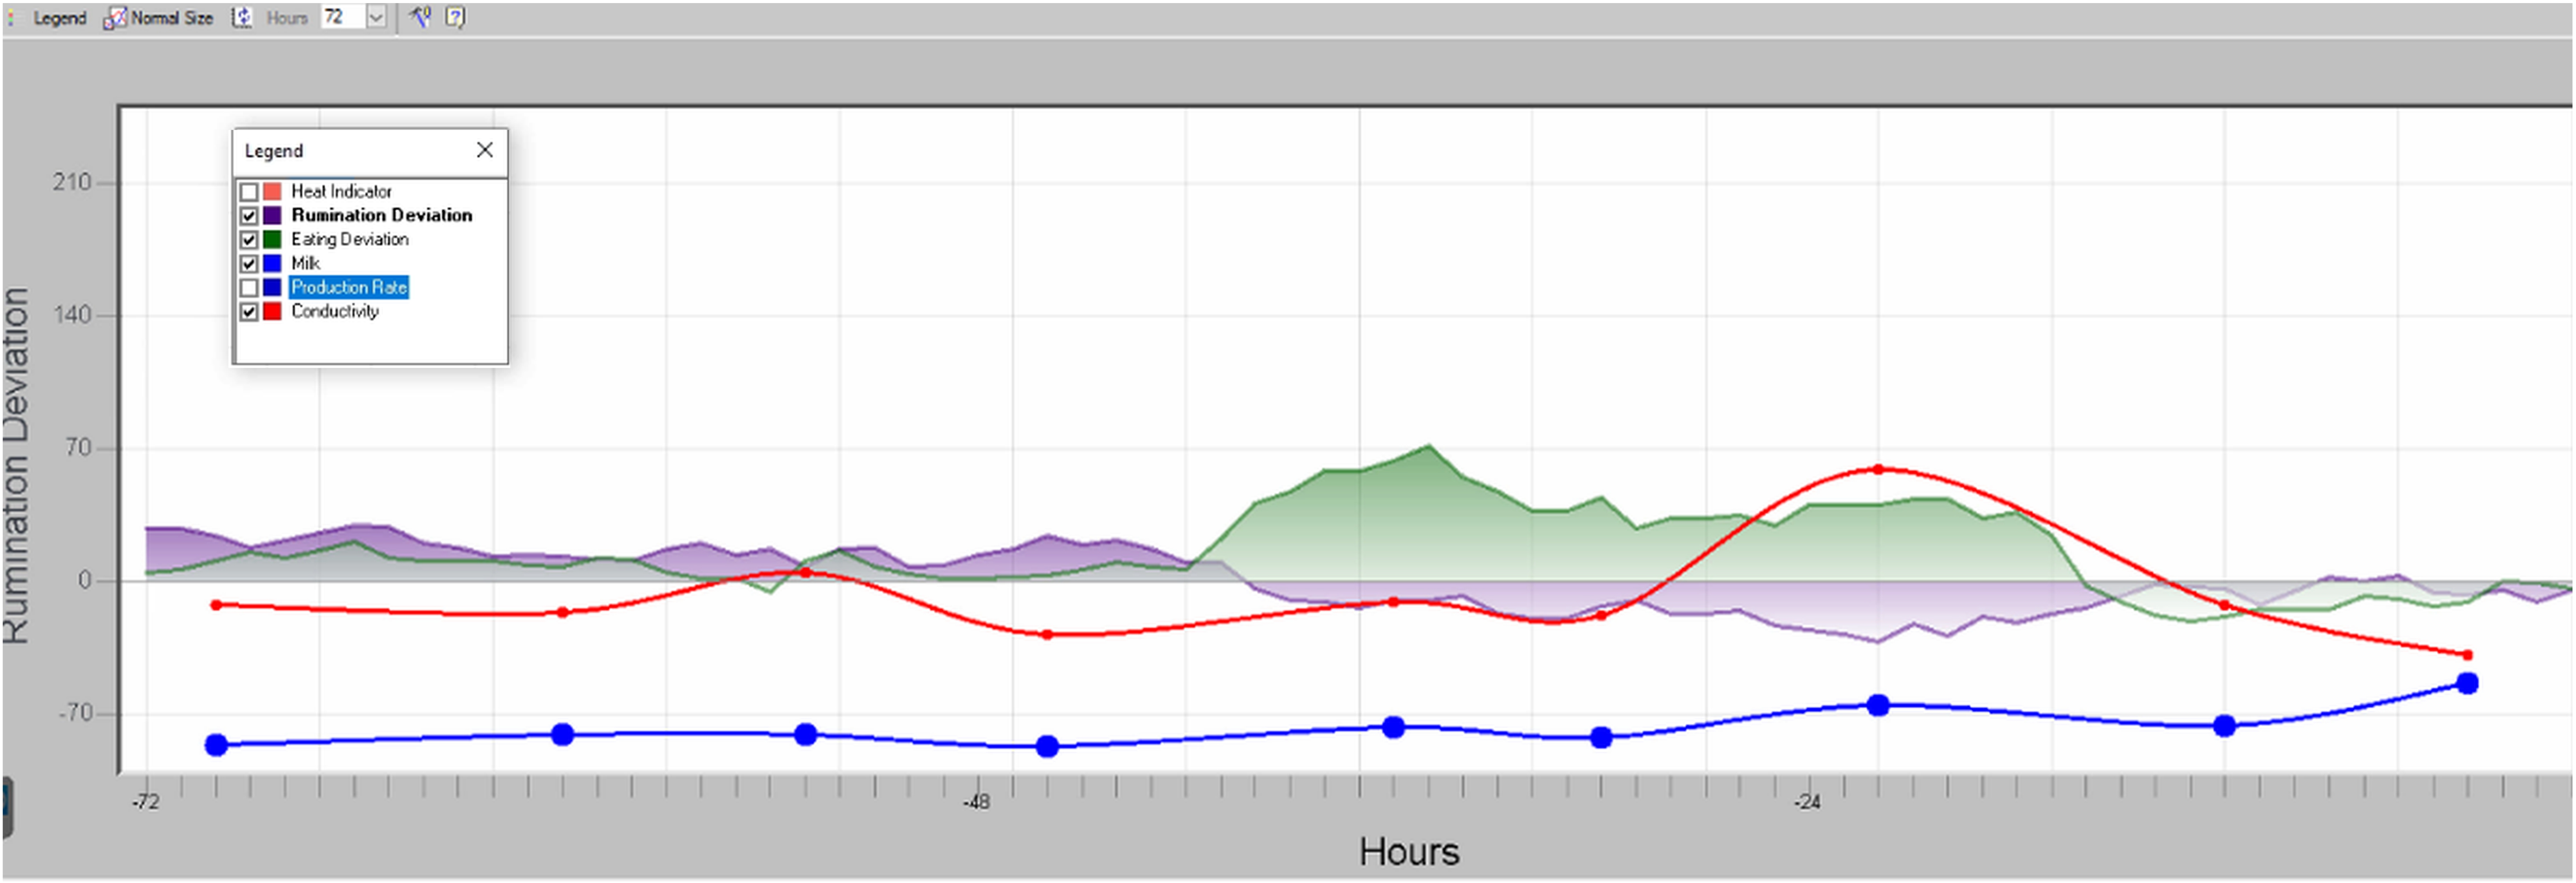
Click a specific row in the Detailed Report to open the animal's behavior deviations for the last 3 days, in a graph view.
Note: On the Activity Indicator axis, 0 represents average standard eating, rumination and activity behavior for the specific animal. Graph legends above 0 indicate above average amount of time spent eating/ruminating/activity, while graph legends that dip below 0 indicate a decrease in the average amount of time spent on the behavior.
The graph displays hourly deviations in the cow's standard eating, rumination and activity behavior, and her milk production. Open the Legend dialog box, then click one of the legend options to view deviations to that behavior.
The example below displays decreases in her conductivity, eating, and rumination in the last day; further confirmation she may have a calving disease.

Fresh cows (5 to 30 DIM) are supposed to increase production after calving. Cows that fail to increase production as expected are likely suffering from a common calving disease.
Click Fresh cows to check on the dashboard to open the associated report.

The table lists all fresh cows whose yields have not increased according to expectation and are therefore suspected of suffering a calving disease. The report is refreshed every hour.
In the report shown, both cows were entered because their yield for the last 24 hours dropped comparatively to their average yield. During this time their yields should have been at an increase.

|
Column |
Description |
|---|---|
|
Cow |
Displays cow number. |
|
Grp |
Displays cow group number. |
|
Gyn. status |
All cows in the report belong to the "Fresh" status, since the report alerts to potential calving diseases. |
|
Lact no |
Displays the cow's lactation number. |
|
DIM |
Displays the number of days in milk (or days since calving). Calving disease occurs soon after calving. Cow's yield is supposed to increase according to her number of DIM. |
|
Yield Last 24H |
Displays the cow's total milk production in the last 24 hours. |
|
Daily avg yield |
Displays the cow's daily average yield for the last 10 days. |
|
Yield Last 24H% |
Displays the % change in yield for the last 24 hours compared to her average daily yield. The report is filtered to list with the highest milk decrease first. Significant drops in yield, or a failure to increase, may be signs of a calving disease. |
|
Production Rate % |
Displays the % deviation in production rate changes for the last completed sessions compared to the cow's 10-day average production rates for the same sessions. |
|
Conductivity % |
Displays the cow's milk conductivity deviation in the last completed sessions, compared to her average conductivity for the same sessions. |