Groups Heat Stress Report
Managing the animals' environment is crucial to maximizing yield. AfiFarm monitors animal behavior. It uses the average group results to determine standard group behavior. Behavior deviations on a group level indicate issues caused by factors in the environment, and not health issues.
Note: To determine if something is impacting the group, a minimum of 75% of the group (and a minimum of 20 animals) must wear an AfiCollar.
Recognizing when animals are suffering from heat stress is crucial for implementing timely solutions.
Heat stress is known to cause production losses. Increased panting time is an indicator of heat stress in cows. To determine heat stress, AfiFarm analyzes the collective panting data of each group. Every hour, AfiFarm calculates how much time the group spent on various behaviors, including panting. If a group's total average panting time exceeds its threshold at any point, the group is marked as experiencing heat stress for that hour.
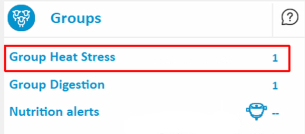
The dashboard alerts to groups currently experiencing heat stress or those that have exceeded the number of set hours in heat stress in the last 24 hours.
Understand the Detailed Report
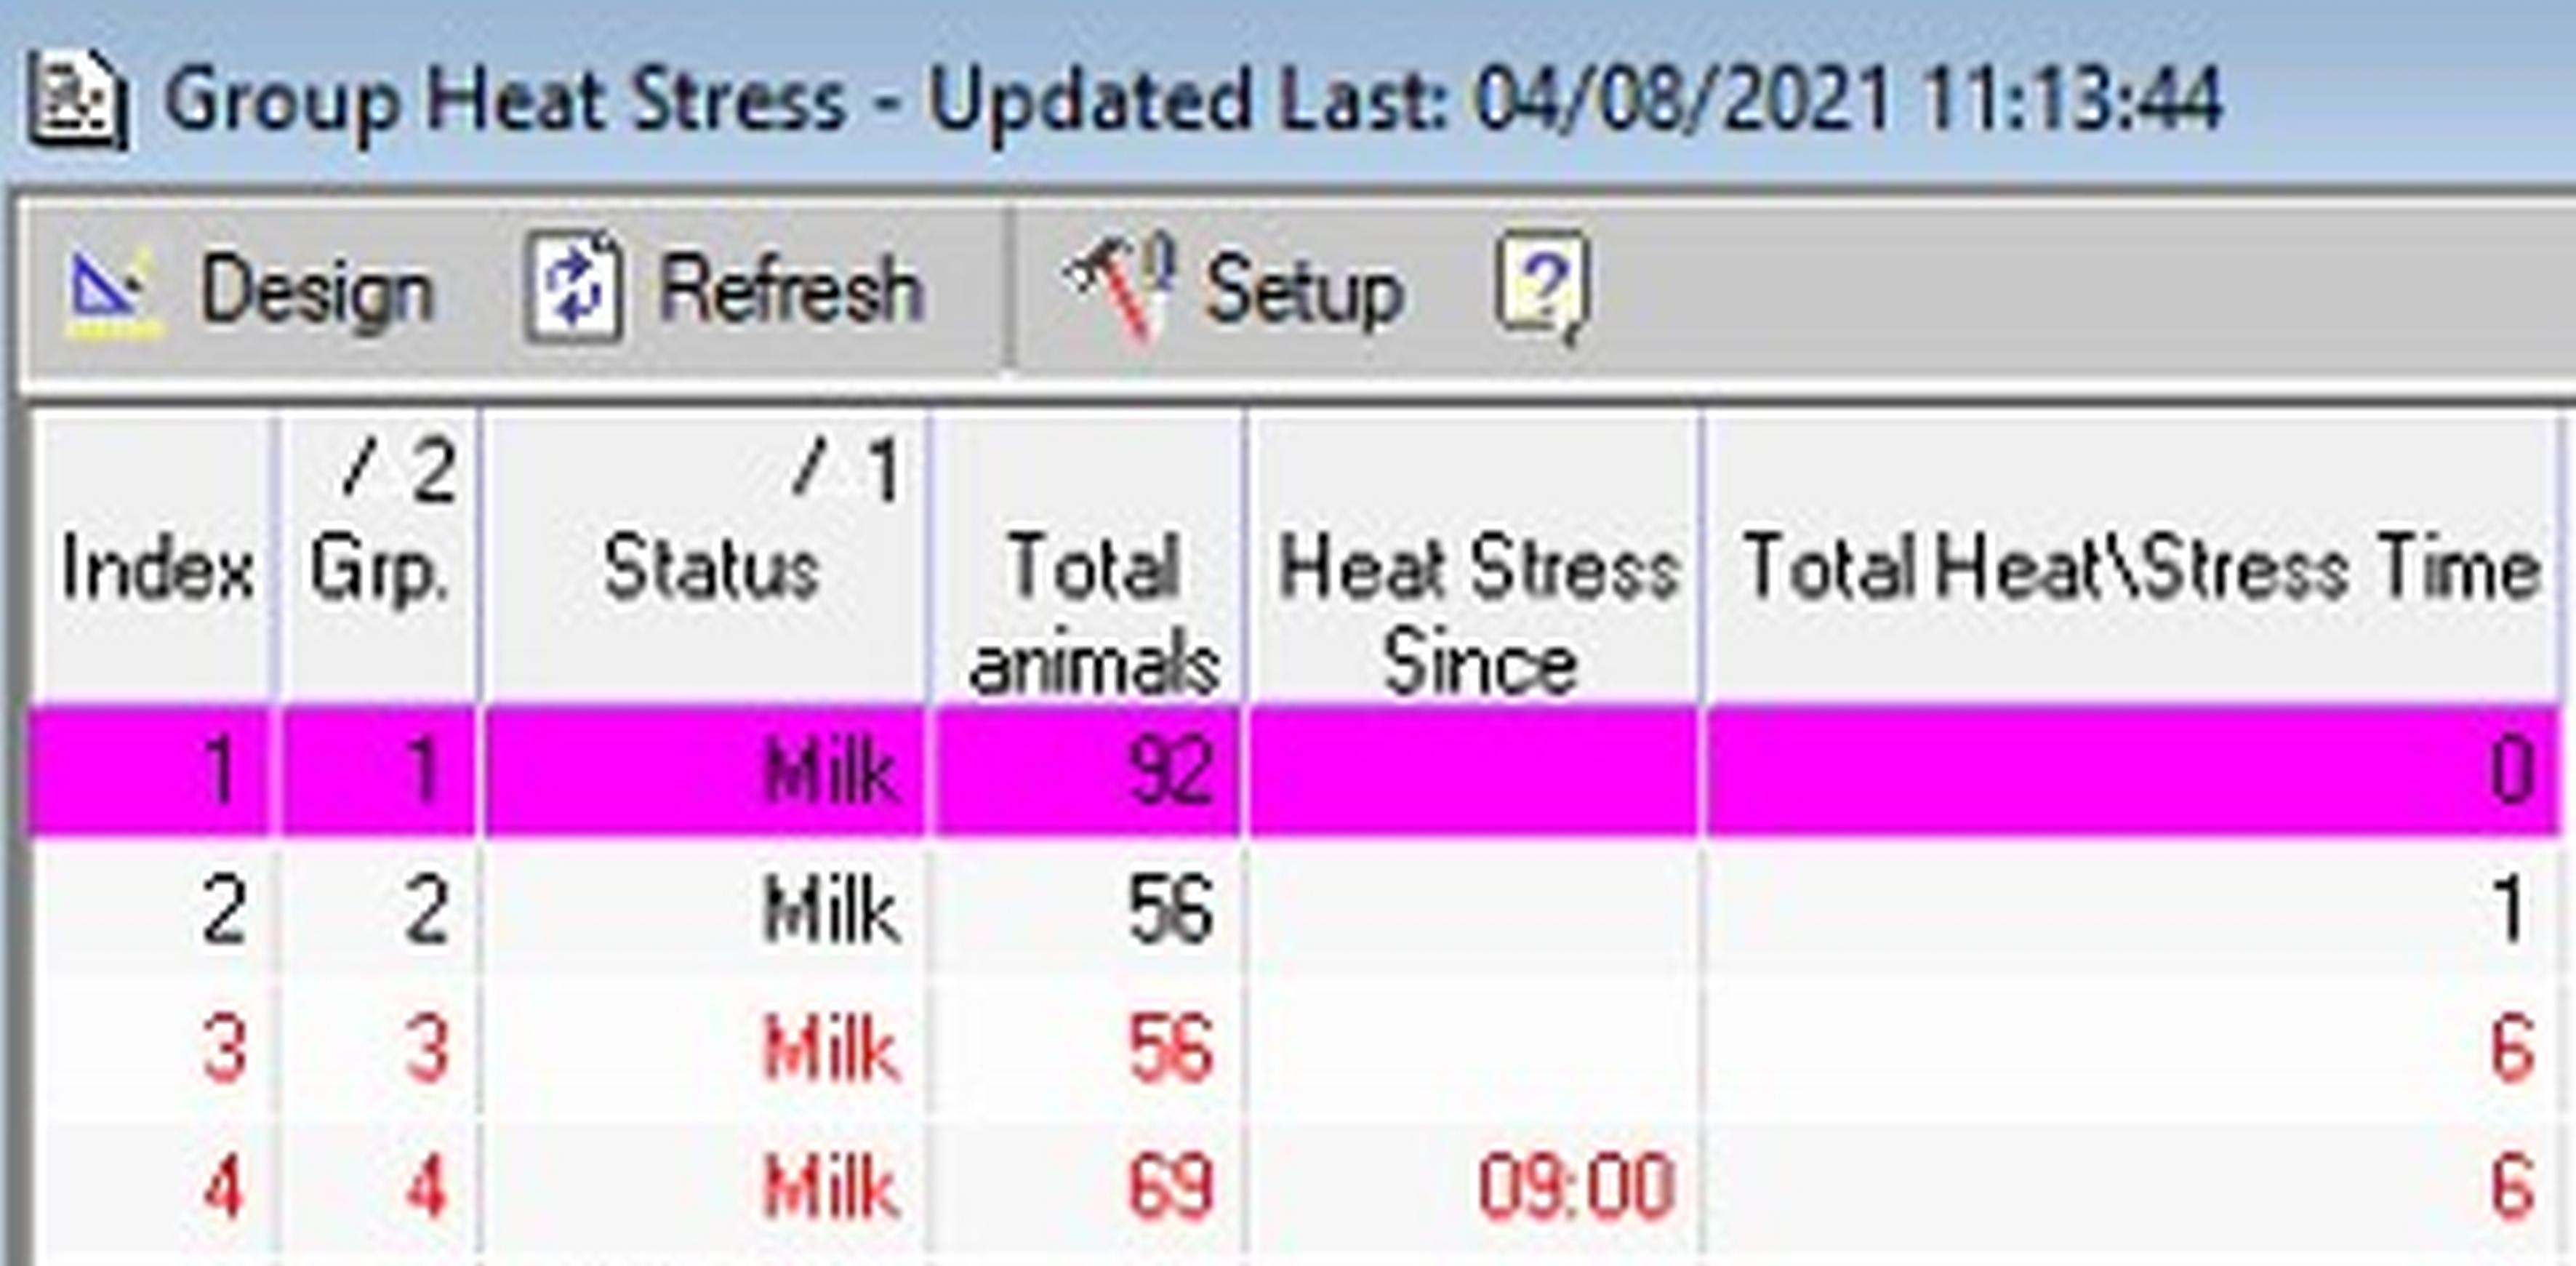
The report displays groups currently in heat stress, or any groups that experienced heat stress in the last 24 hours.
Red values indicate groups that have experienced heat stress.
|
Column |
Description |
|---|---|
|
Heat Stress Since |
A value displayed in this column indicates a group that is currently in heat stress. The value in this column indicates the hour when the group first entered heat stress and has remained in heat stress until the current time. |
|
Total Heat/Stress Time |
A value displayed in this column indicates the group experienced heat stress in the last 24 hours. The value in this column indicates the total amount of time, in hours, the group was in heat stress in the last 24 hours. |
Click the row in the report to view the group's heat stress graph.
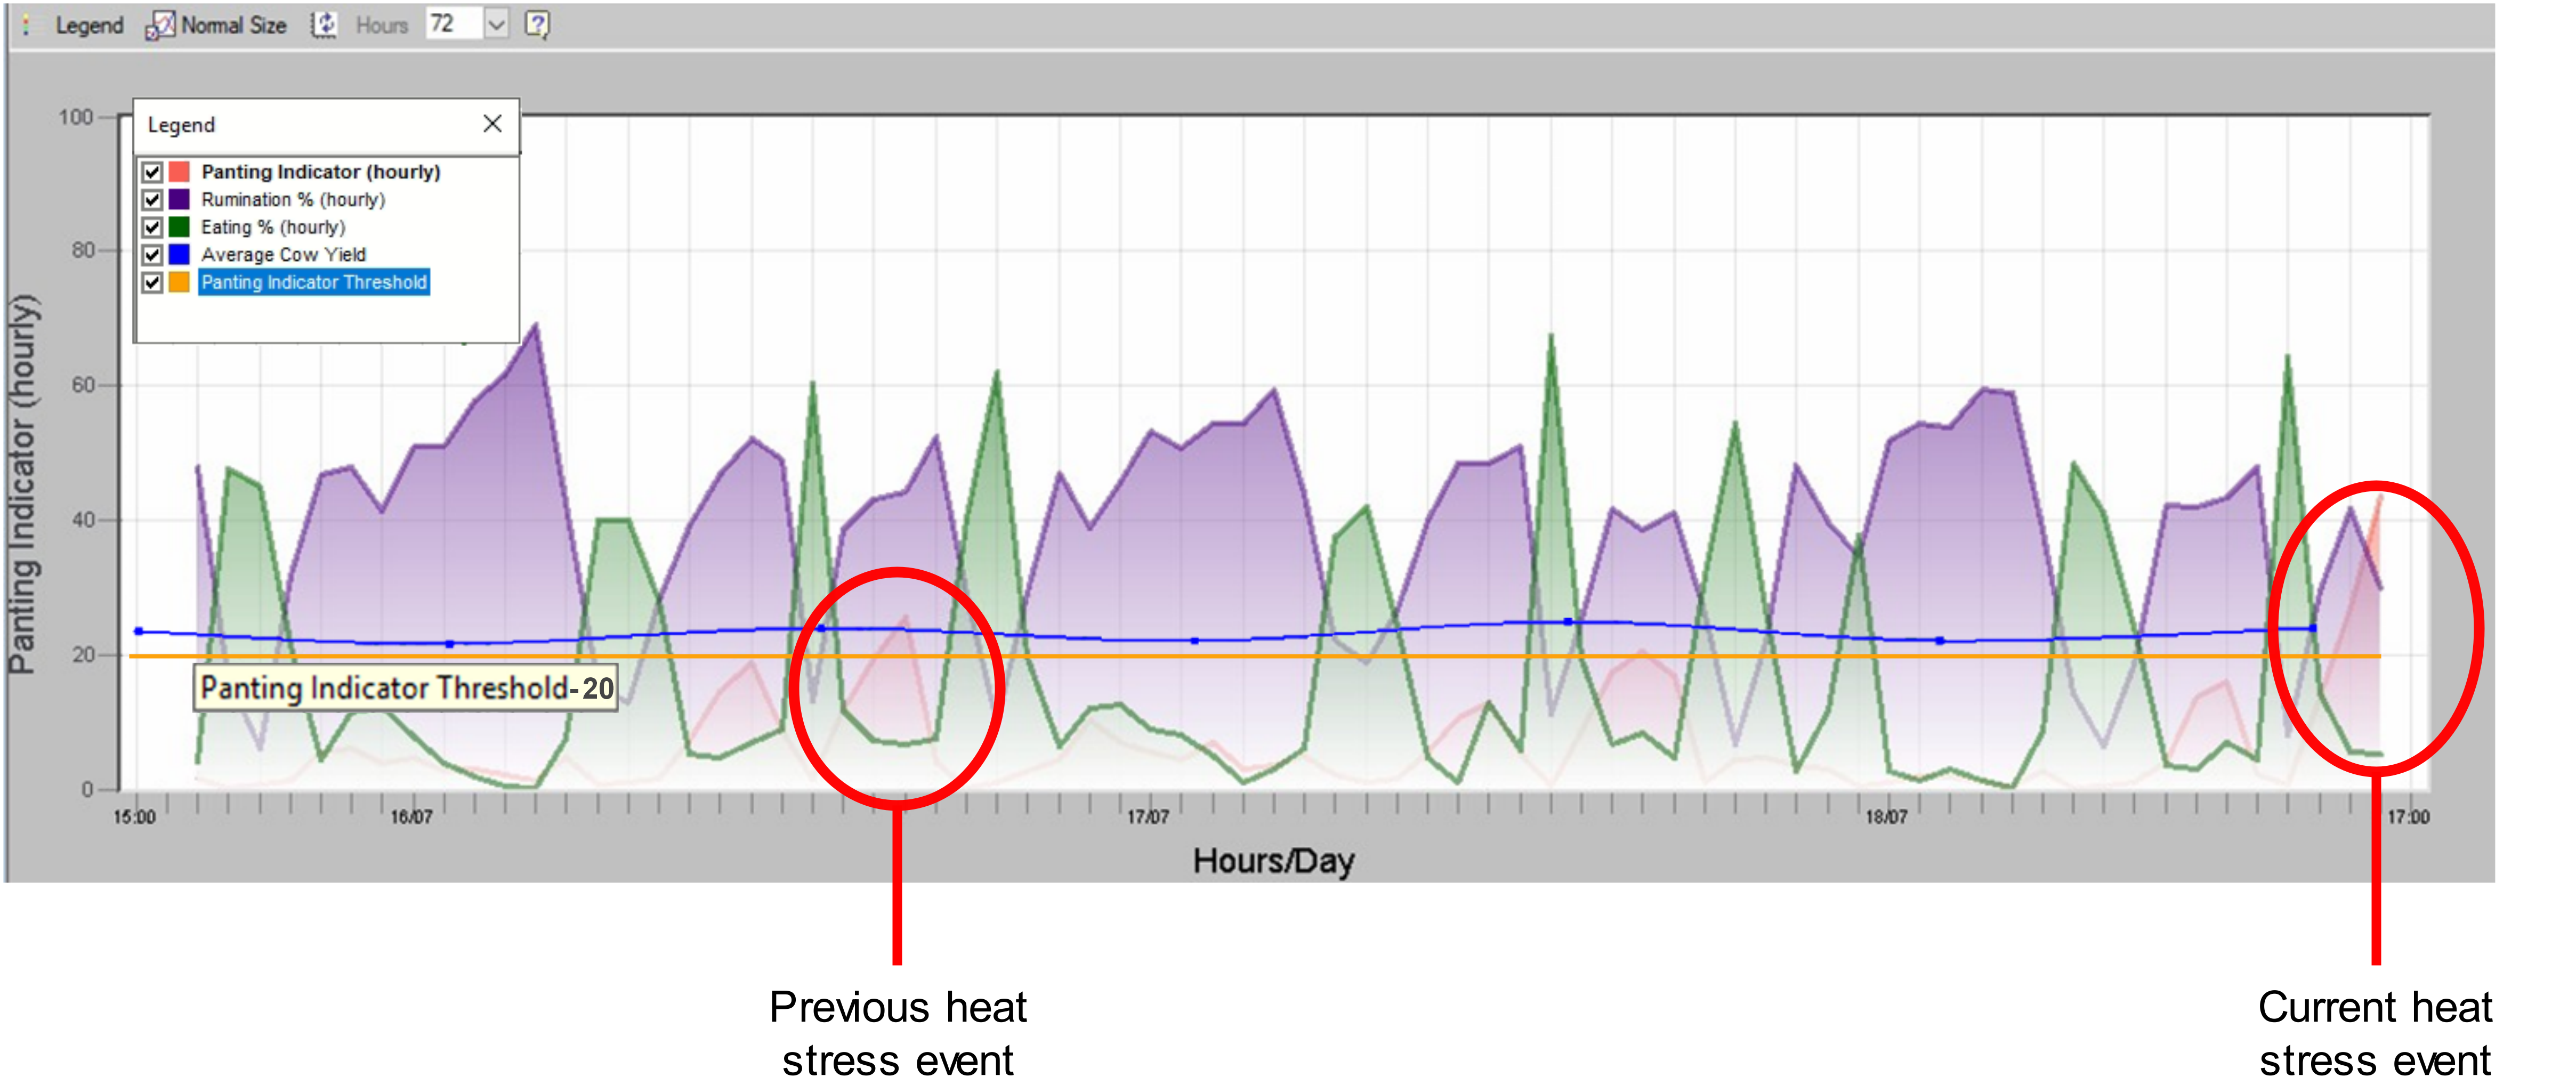
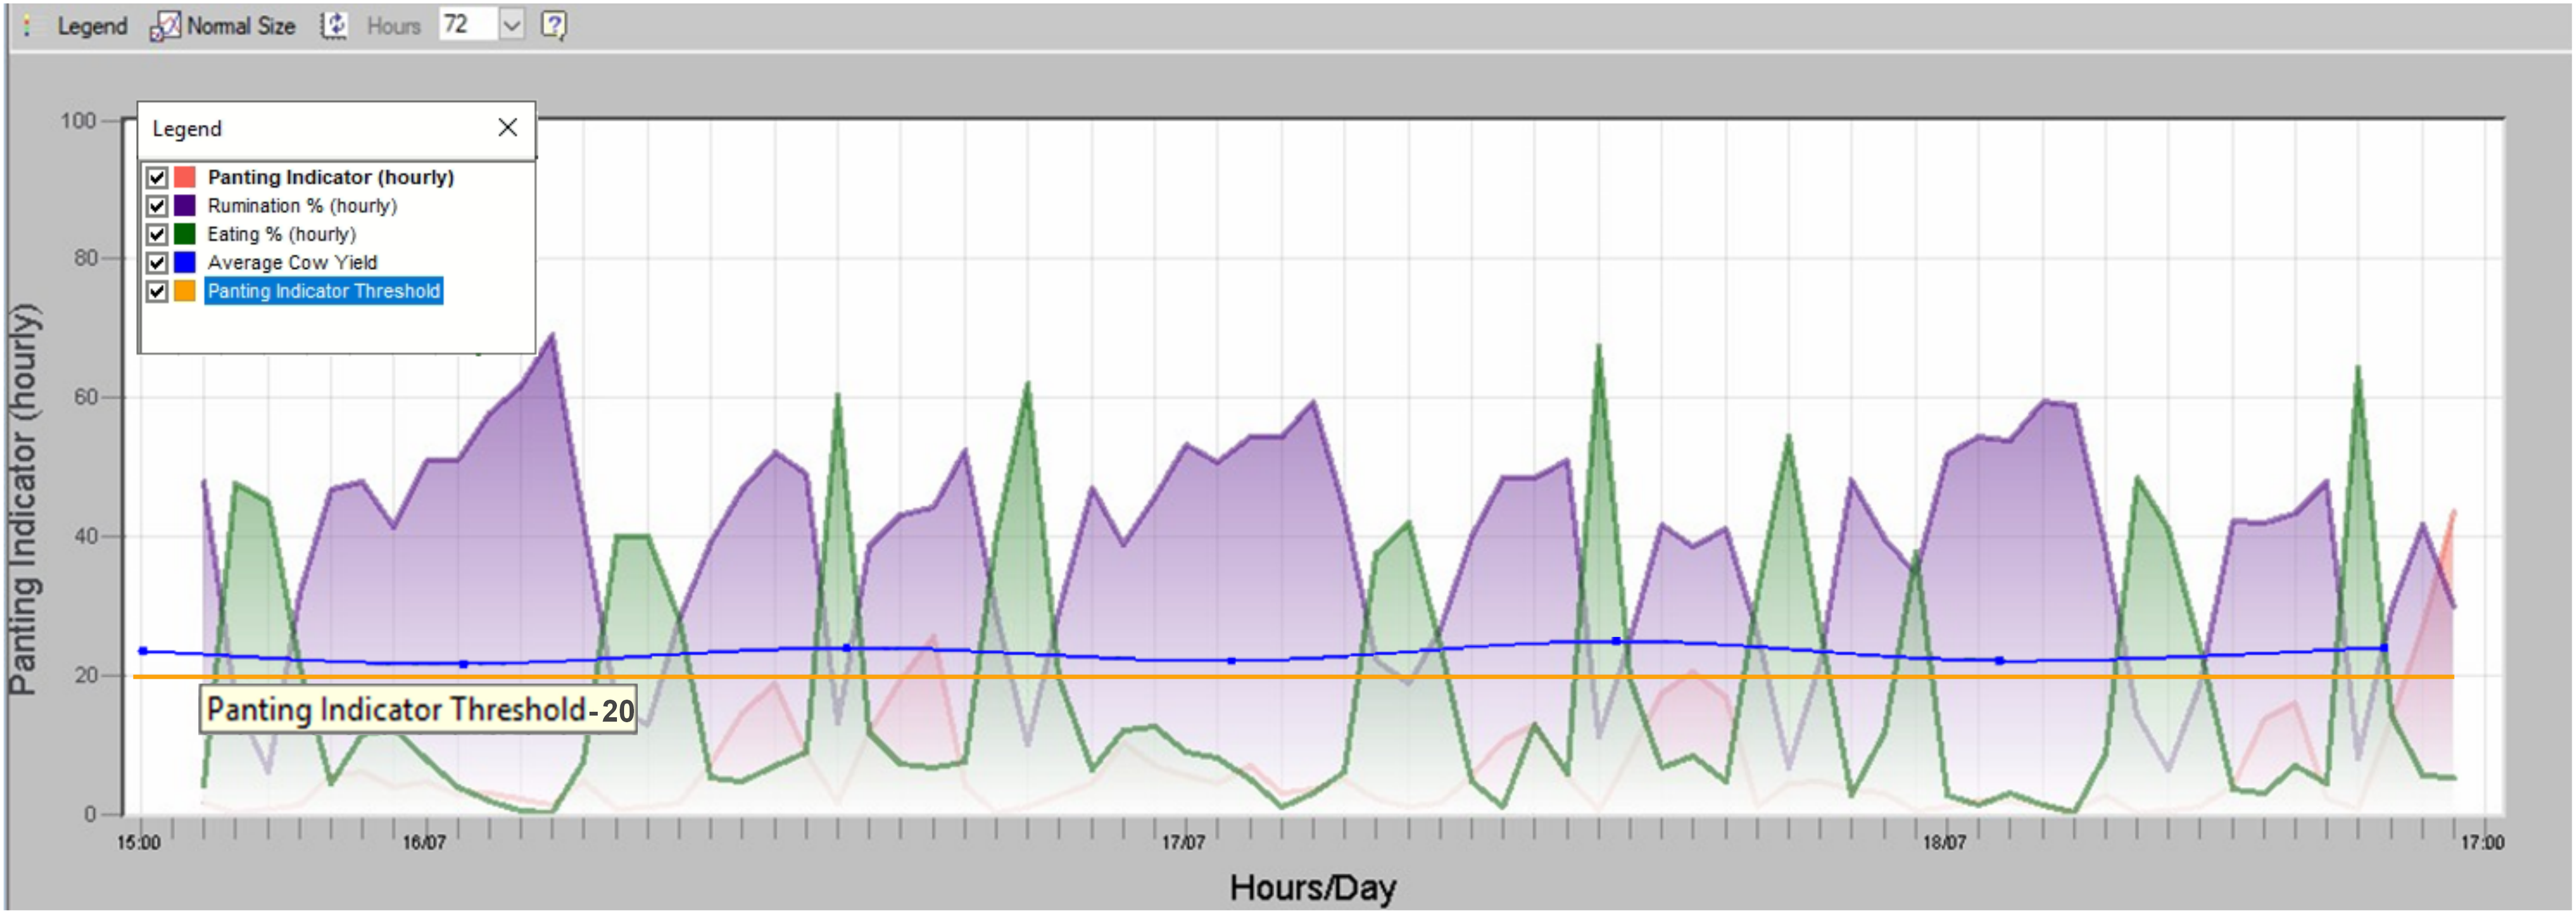
Heat stress is measured according to the group's total panting time for each hour. When this time exceeds the threshold for that hour, the group is considered in heat stress. The example graph below shows a group currently in heat stress. In the image, the Panting Indicator (red legend) exceeds the Panting Indicator Threshold (yellow legend).
Note: The Heat Stress thresholds can be adjusted to be more, or less, sensitive see below for instructions on setting the panting indicator threshold.
We can see the group also suffered heat stress two days earlier, around the same time of day.
Use the Heat Stress report to monitor patterns, plan and implement a strategy to relieve the cows from heat stress, then revisit the report to determine if the intervention is effective, see the example below.
Monitor Patterns: Determine Cause and Assign Intervention
Monitoring eating, panting, and rumination patterns help determine the cause of heat stress (such as direct sunlight in a pen), and the effectiveness of interventions.
In the example below, the current time is 17:05. Group 2 has been in consecutive heat stress since 15:00. In the last 24 hours, Group 2 has experienced heat stress for a total of 2 hours.
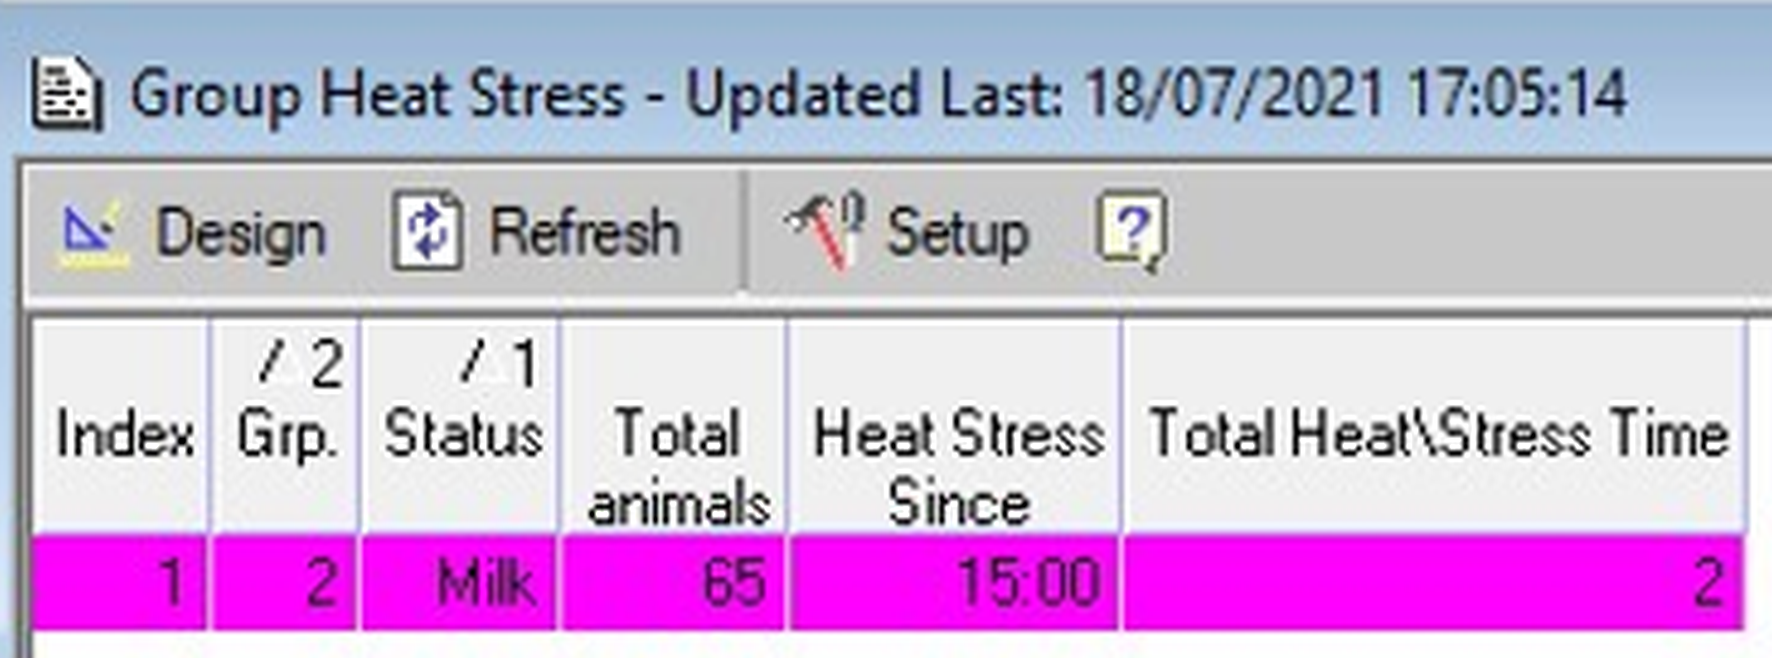
Group 2 Heat Stress graph is displayed below.
Identify Heat Stress Pattern
Remove the Rumination and Eating legends (leaving only the Panting legend) to identify daily heat stress patterns. These patterns help identify the optimal timing of intervention.
Note: The image below shows the group starts to experience extensive heat stress at around 11:00 and 16:00 each day, and slight heat stress again at night (22:00).
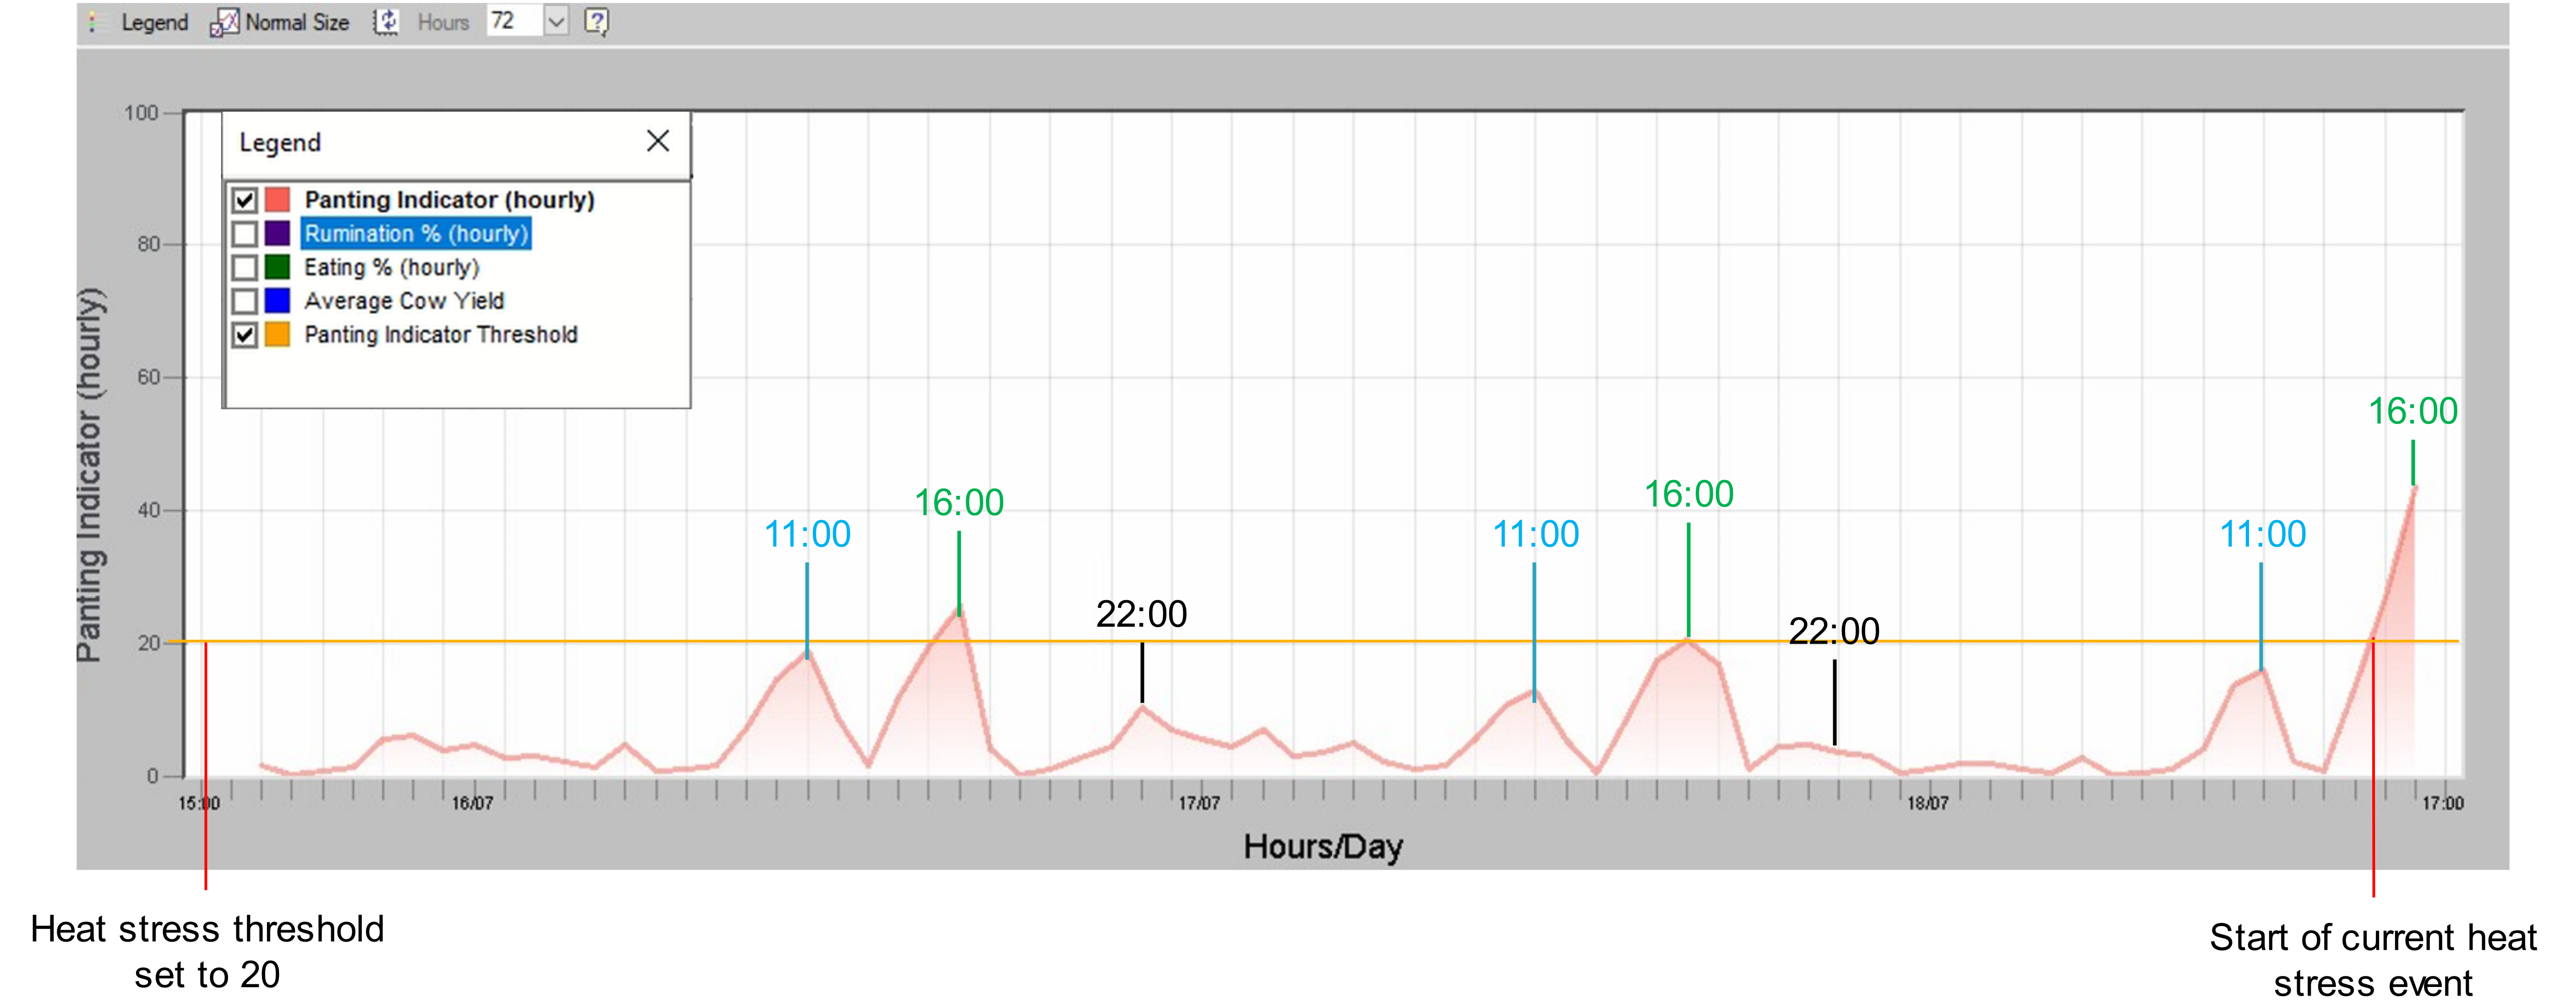
Based on the pattern, intervention such as showering, can be implemented when the heat stress begins.
Determine Intervention Efficacy
View the group's heat stress graph to review if the intervention was effective.
Increases in panting, and decreases in eating are symptoms of heat stress. This means, effective interventions should be reflected in lower panting rates, and increased eating rates. View the Eating and Panting legends together to determine the effectiveness of the heat-stress interventions.
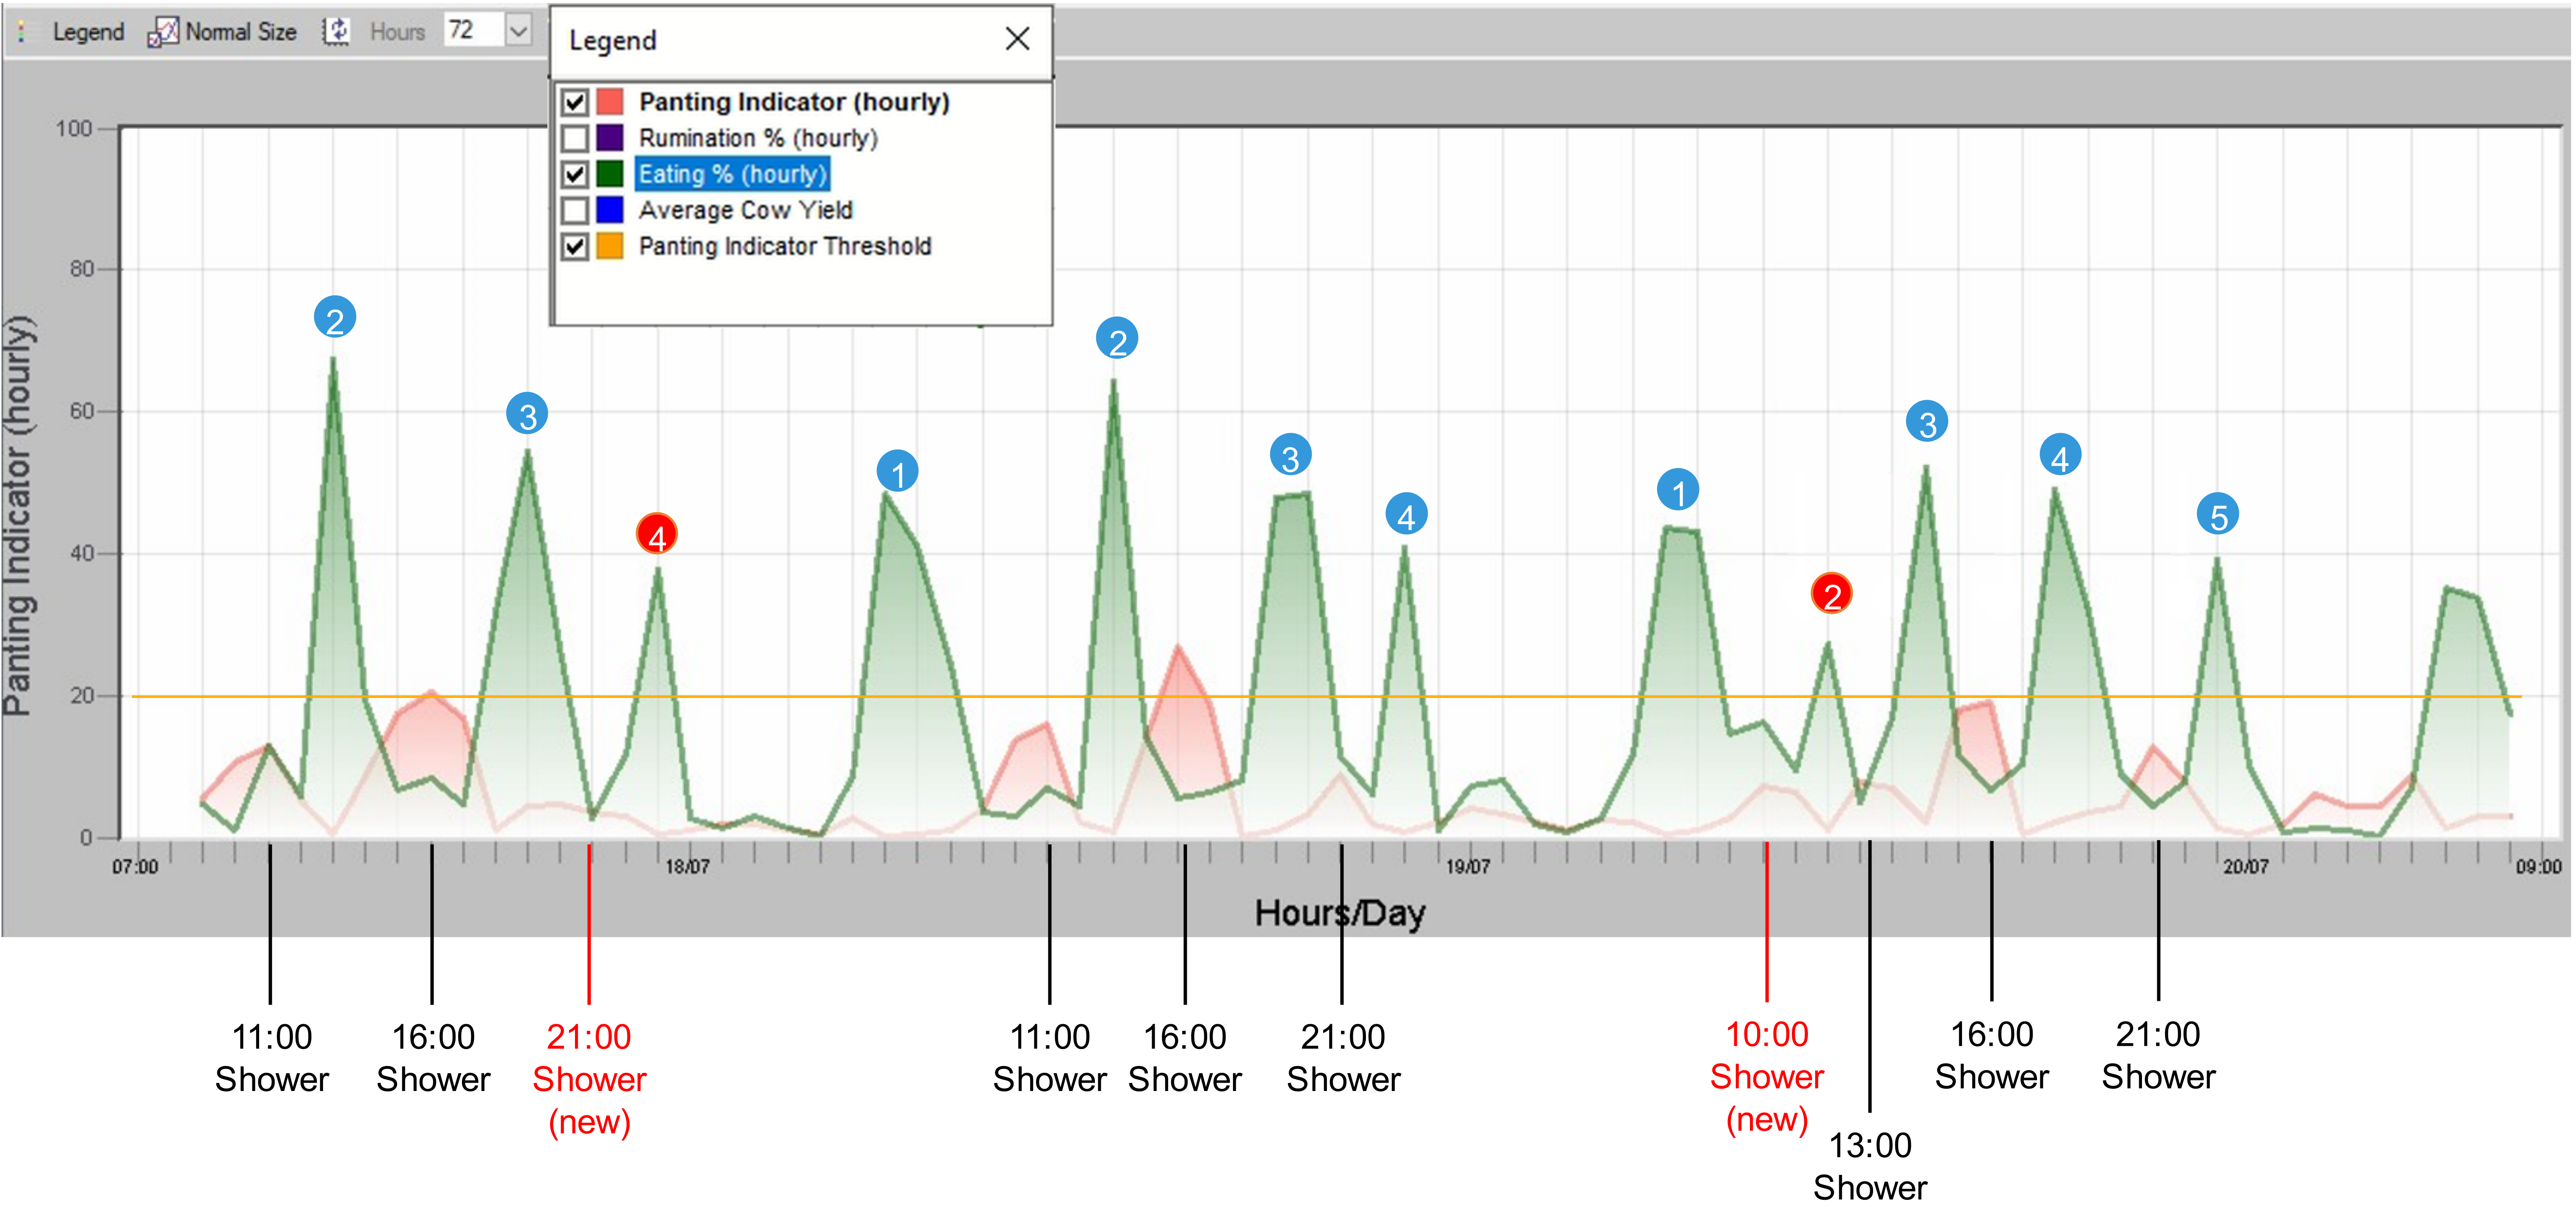
Note: Following each shower, panting rates decrease, tailed by a spike in eating: On the first day (17/07), an additional shower was added in the evening (21:00) – this led to a fourth eating session (#4). The same routine is confirmed the next day (18/07). On the third day (19/07) an additional morning shower was added (10:00), and this added an additional morning feed (#2), and maintained the group's comfort zone to below heat-stress levels throughout the day.
View and Adjust Heat Stress Report Thresholds
The group heat stress alert is activated when the amount of time the group displays signs of heat stress (measured by the amount of time panting) exceeds the set threshold.
By default, the heat stress indicator threshold is set to 50. This means, if the group's total average time spent panting exceeds 50% of its activity time, then the group is marked as experiencing heat stress for that hour.
Adjust the default thresholds and increase or decrease the heat stress alert sensitivity.
To adjust the heat stress thresholds
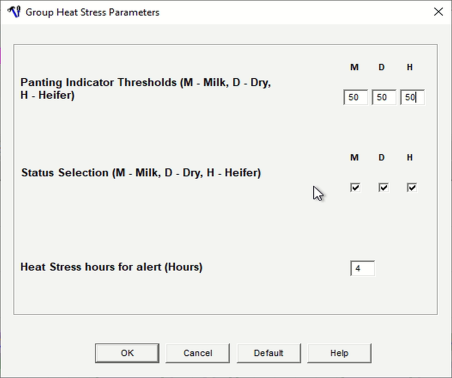
In the Group Heat Stress report toolbar, click the Setup button  .
.
Lower the Panting Indicator Thresholds to increase heat stress sensitivity, activate alerts to heat stress earlier, and increase the number of groups defined as experiencing heat stress.
Likewise, raise the threshold to decrease heat stress sensitivity, delay alerts to heat stress, and decrease the number of groups defined as experiencing heat stress.
You can also increase or decrease the number of hours of heat stress required in the last 24 hours before an alert is issued.
In the example, if a group is in heat stress for four hours or more in the last 24 hours, an alert is issued, and the group is added to the Heat Stress Report.
The heat stress feature is only available to farms with the AfiCollar configuration.