Nutrition Alerts
Nutrition issues can lead to a range of health problems such as sub-acute ruminal acidosis (SARA), low fat syndrome.
Farms with AfiLabs installed benefit from daily measurements of each group's fat and protein components. Alerts are issued when these components deviate beyond their standard averages – indicating possible issues with the group's nutrition.
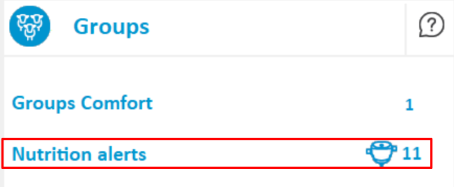
Nutrition alerts are displayed when there is a drop in the daily milk components of a group. When this occurs, an alert is displayed on the ABC Dashboard. Changes in a group's components are caused by a problem with the feed, such as change in size, or distributions. An alert is triggered that points you to areas in your feeding system that require checking and correcting.
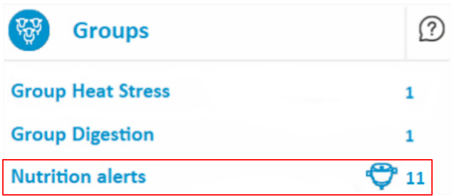
Click Nutrition alerts to open the report (refreshed every session).
Note: Nutrition alerts are only available in farms using AfiLabs. If the AfiLab option is not installed, the option is disabled.
Nutrition Monitoring Report
The report is updated daily and displays changes to fat or protein in the last 24 hours, and over the last 5 days.
Click a row or field to display the detailed report for each cow in the selected group.
Note: A value outside the threshold range that is detected in one or more groups indicates a problem within the specific group(s).
Note: A problem detected in all the groups indicates a broader issue affecting the entire herd.
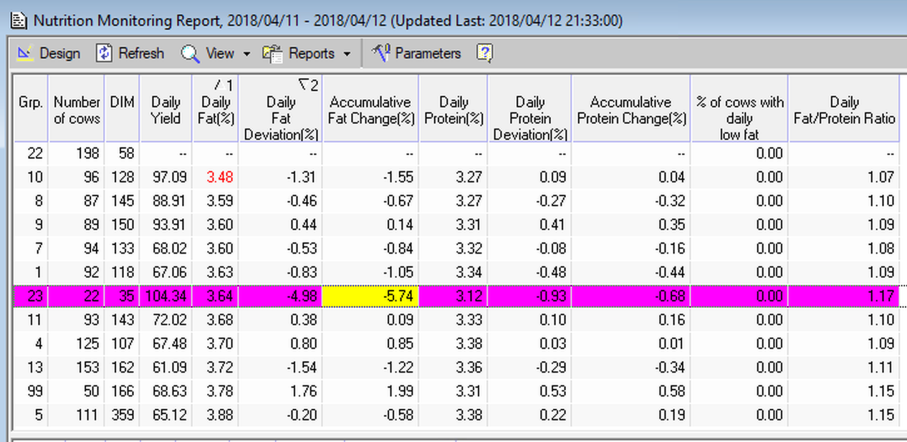
Note: Red value in the report indicates a group with a Nutrition alert.
|
Column |
Description |
|---|---|
|
Grp |
Group number |
|
Number of cows |
Number of milk cows in each group |
|
DIM |
Average DIM of the cows in each group |
|
Daily yield |
Average group yield for the last 10 days |
|
Daily Fat % |
Average daily fat % for the last 10 days for each group. |
|
Daily Fat Deviation % |
Deviation % of fat in sessions in the last 24 hours, compared to the 10 Day averages. |
|
Accumulative Fat Change % |
Accumulative fat change over the last 5 days. |
|
Daily Protein % |
Average daily protein % for the last 10 days for each group. |
|
Daily Protein Deviation % |
Deviation % of protein in sessions in the last 24 hours, compared to the 10 Day averages. |
|
Accumulative Protein Change % |
Accumulative protein change over the last 5 days. |
|
% of cows with daily low fat |
% of cows with milk fat of 2.5 or less in each group Red value indicates more than 10% of cows in the group has low fat. Note: Check ration over mixing, feed distribution frequency and time, feed pushing and frequency |
|
Daily Fat/Protein ratio |
Daily fat-protein ratio for each group. Ratio of 1.0 or less may indicate Acidosis. Acidosis can be caused by insufficient roughage or over mixing. For more information see Detect Sub-Acute Ruminal Acidosis, Monitor Herd Fat/Protein Ratio , and Verify Causes of Nutritional Imbalances |
Switch between Detailed Report and Graph View
The graph view provides an accessible format for viewing daily trends in milk components. The Detailed Report
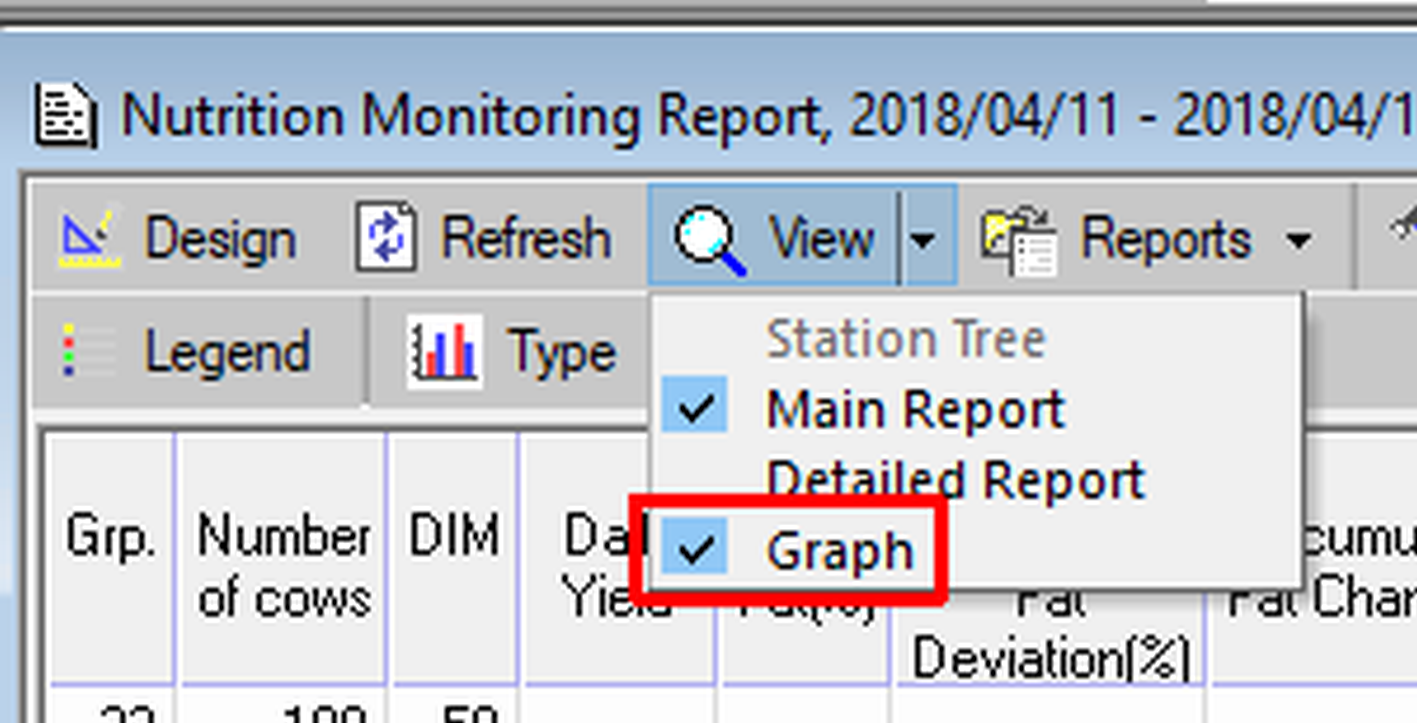
To switch between the Graph / Detailed Report:
On the report menu, click View, then click Graph or Detailed Report.
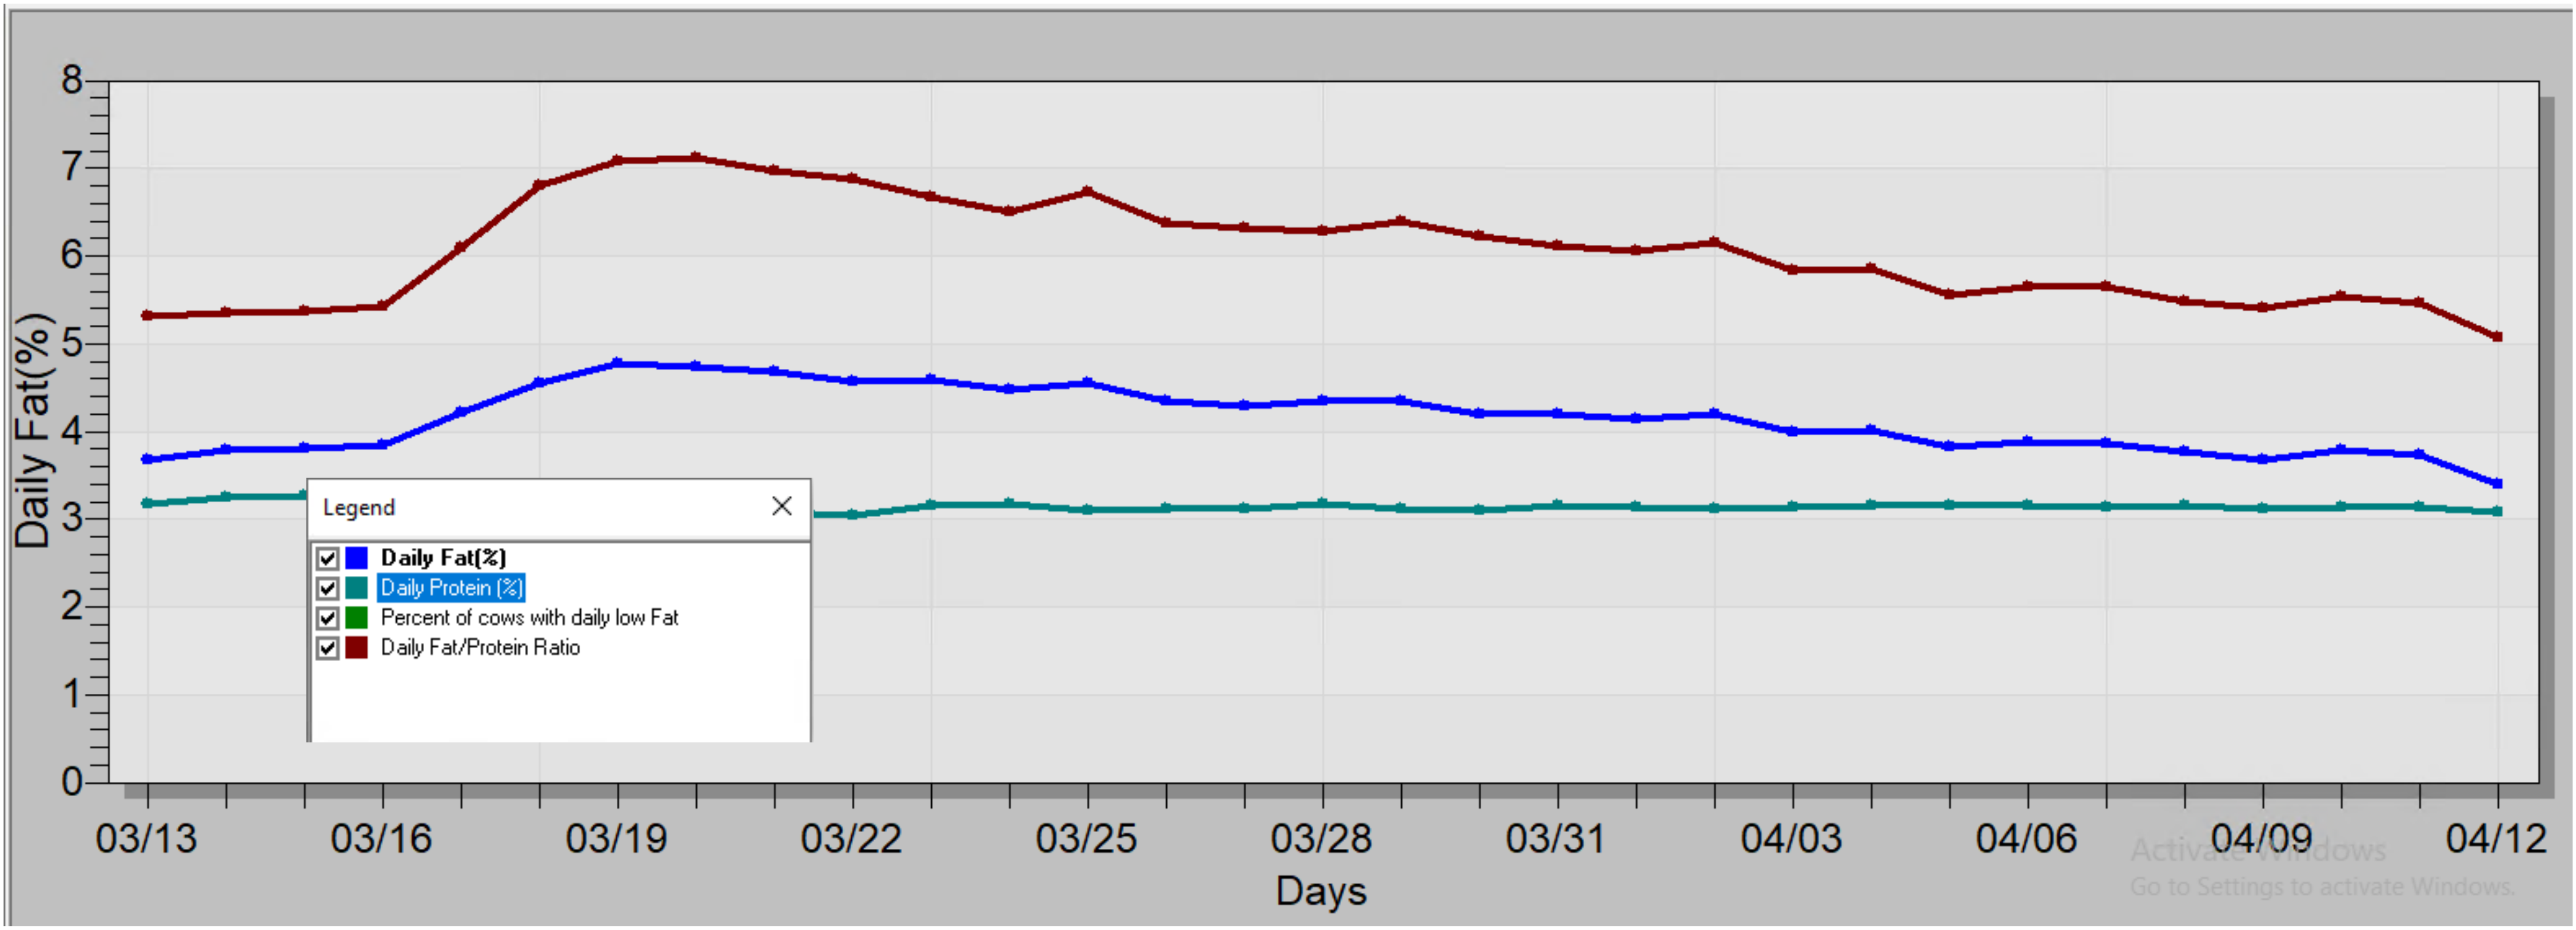
Graph View
The Graph view displays data for the last month. The Nutrition Monitoring Graph below shows a consistent drop in Fat/Protein ratio and Daily fat % since 19 March, indicating a problem with nutrition.
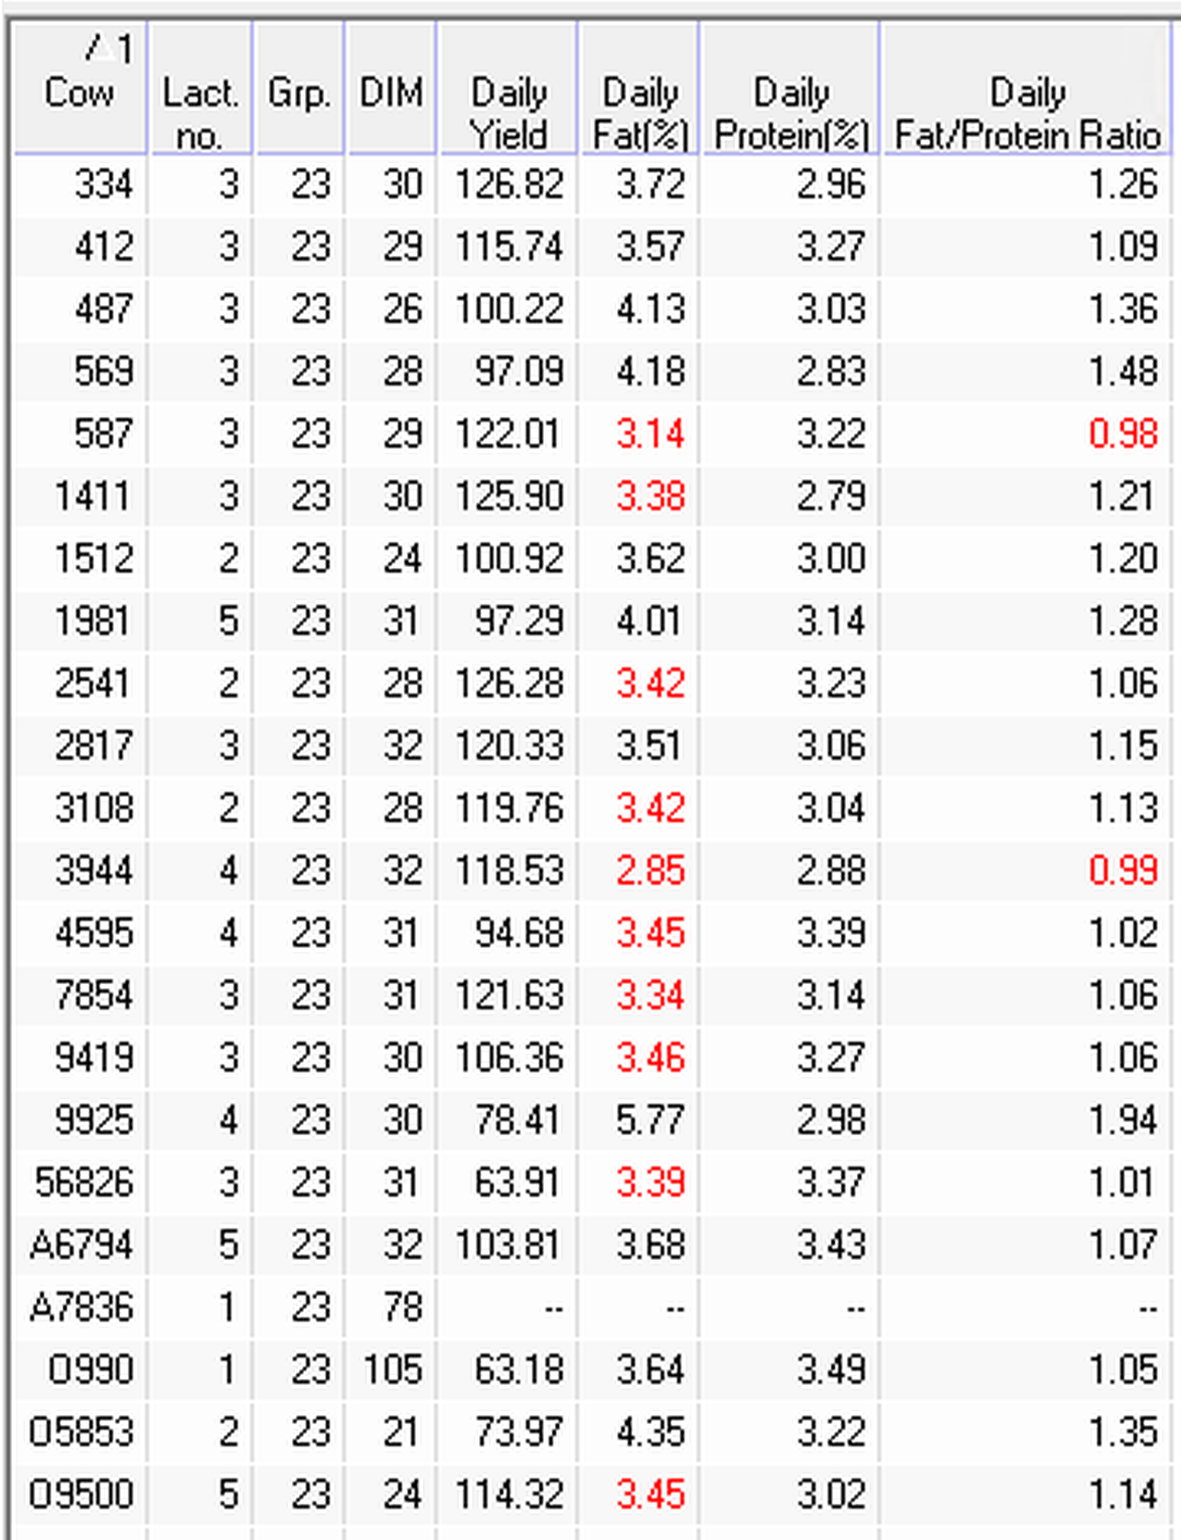
Detailed Report
The Detailed report displays the data for yield and milk components for each cow in the group. The red values indicate cows whose components dropped below set thresholds.
Nutrition issues can lead to a range of health problems such as sub-acute ruminal acidosis (SARA), low fat syndrome.
Farms with AfiLabs installed benefit from daily measurements of each group's fat and protein components. Alerts are issued when these components deviate beyond their standard averages – indicating possible issues with the group's nutrition.
Nutrition alerts are displayed when there is a drop in the daily milk components of a group. When this occurs, an alert is displayed on the ABC Dashboard. Changes in a group's components are caused by a problem with the feed, such as change in size, or distributions. An alert is triggered that points you to areas in your feeding system that require checking and correcting.
Click Nutrition alerts to open the report (refreshed every session).
Note: Nutrition alerts are only available in farms using AfiLabs. If the AfiLab option is not installed, the option is disabled.
Nutrition Monitoring Report
The report is updated daily and displays changes to fat or protein in the last 24 hours, and over the last 5 days.
Click a row or field to display the detailed report for each cow in the selected group.
Note: A value outside the threshold range that is detected in one or more groups indicates a problem within the specific group(s).
Note: A problem detected in all the groups indicates a broader issue affecting the entire herd.
Note: Red value in the report indicates a group with a Nutrition alert.
|
Column |
Description |
|---|---|
|
Grp |
Group number |
|
Number of cows |
Number of milk cows in each group |
|
DIM |
Average DIM of the cows in each group |
|
Daily yield |
Average group yield for the last 10 days |
|
Daily Fat % |
Average daily fat % for the last 10 days for each group. |
|
Daily Fat Deviation % |
Deviation % of fat in sessions in the last 24 hours, compared to the 10 Day averages. |
|
Accumulative Fat Change % |
Accumulative fat change over the last 5 days. |
|
Daily Protein % |
Average daily protein % for the last 10 days for each group. |
|
Daily Protein Deviation % |
Deviation % of protein in sessions in the last 24 hours, compared to the 10 Day averages. |
|
Accumulative Protein Change % |
Accumulative protein change over the last 5 days. |
|
% of cows with daily low fat |
% of cows with milk fat of 2.5 or less in each group Red value indicates more than 10% of cows in the group has low fat. Note: Check ration over mixing, feed distribution frequency and time, feed pushing and frequency |
|
Daily Fat/Protein ratio |
Daily fat-protein ratio for each group. Ratio of 1.0 or less may indicate Acidosis. Acidosis can be caused by insufficient roughage or over mixing. For more information see Detect Sub-Acute Ruminal Acidosis, Monitor Herd Fat/Protein Ratio , and Verify Causes of Nutritional Imbalances |
Switch between Detailed Report and Graph View
The graph view provides an accessible format for viewing daily trends in milk components. The Detailed Report
To switch between the Graph / Detailed Report:
On the report menu, click View, then click Graph or Detailed Report.
Graph View
The Graph view displays data for the last month. The Nutrition Monitoring Graph below shows a consistent drop in Fat/Protein ratio and Daily fat % since 19 March, indicating a problem with nutrition.
Detailed Report
The Detailed report displays the data for yield and milk components for each cow in the group. The red values indicate cows whose components dropped below set thresholds.