Monitor Herd Fat/Protein Ratio
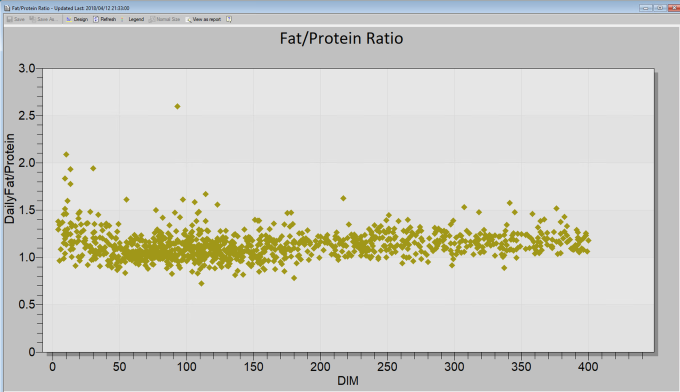
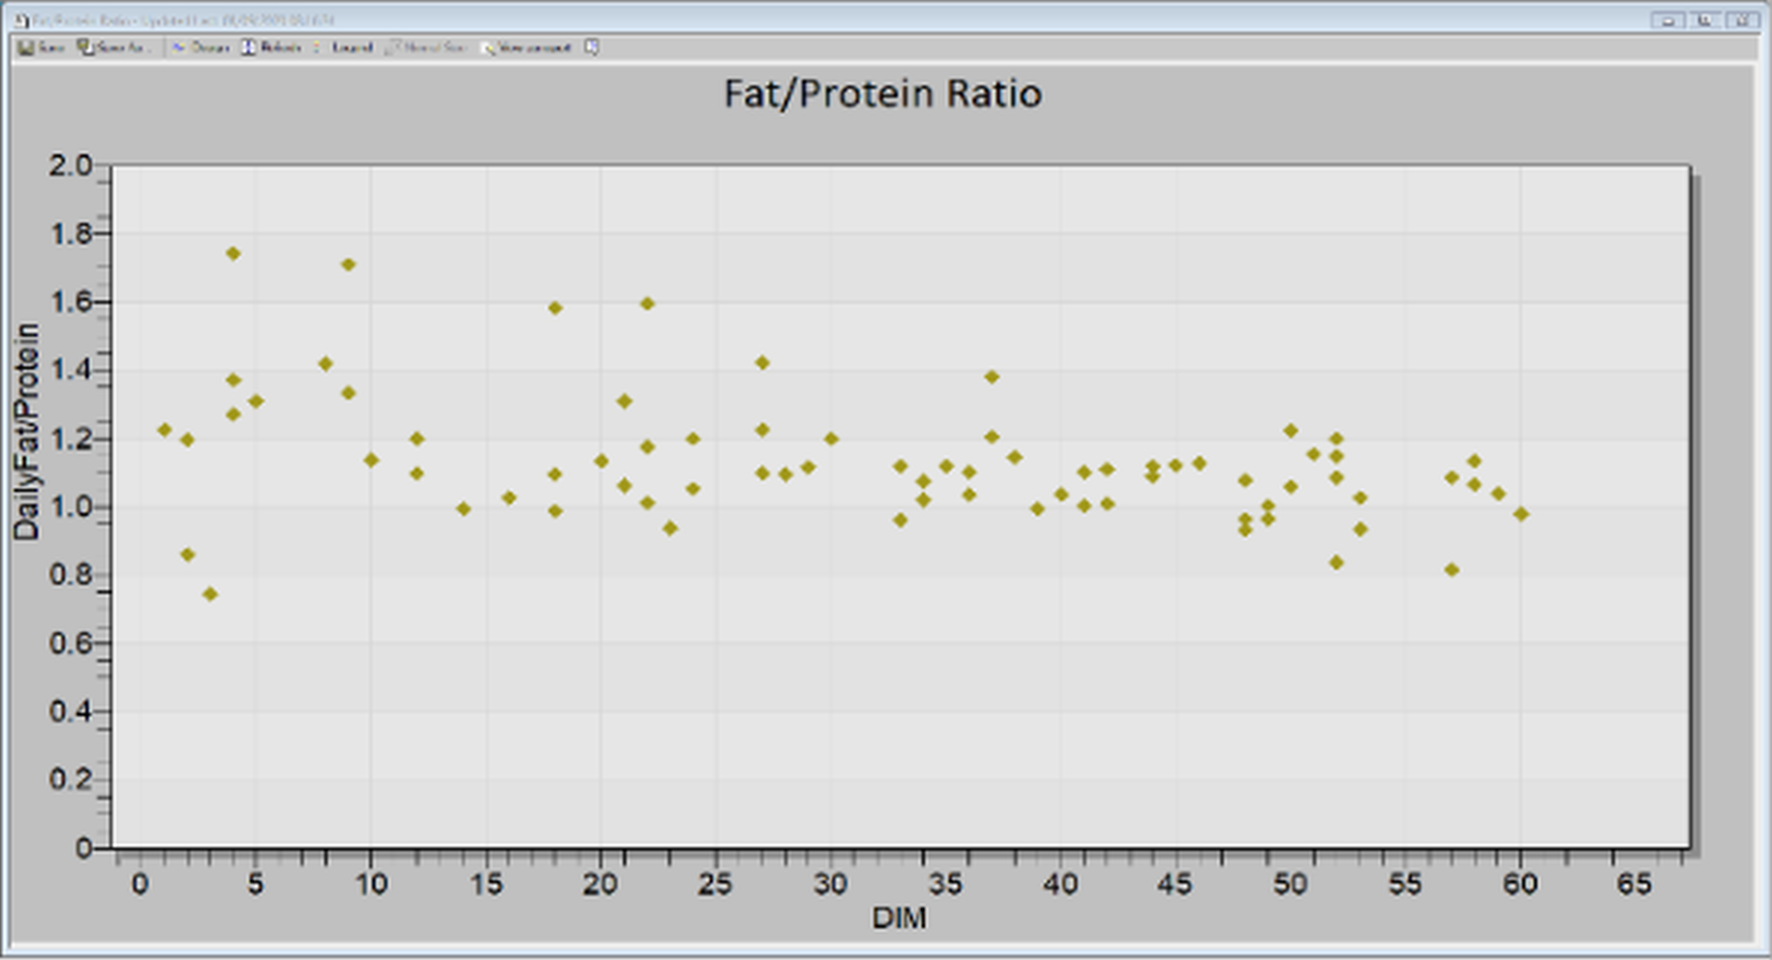
Use the Fat/Protein Ratio graph to monitor the energy balance situation of your herd. The graph shows the ratio of all the milking cows throughout the lactation and is used to identify general nutrition problems in the herd.
The Fat/Protein Ratio graph provides an overview of the energy balance of the herd. It also allows you to identify problems at specific times in lactation.
Note: Each point on the graph represents a single cow.
See more details about how to access the Fat/Protein Ratio graph and how to adjust the graph design view.
The Fat/Protein graph provides the following information:
|
Data |
Description |
|---|---|
|
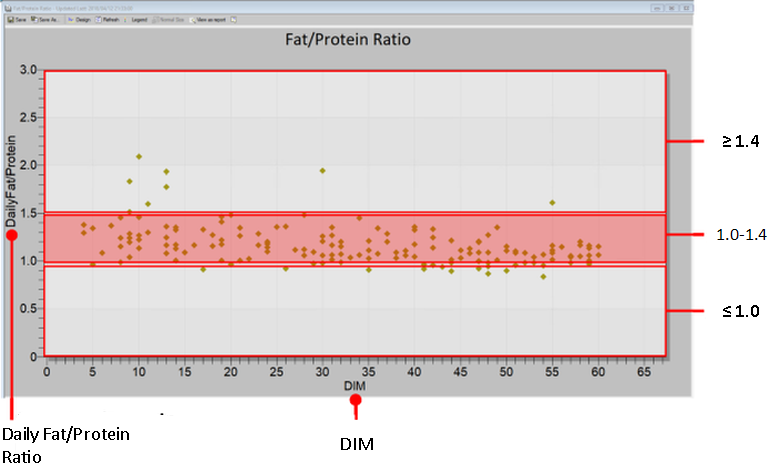
Daily Fat/Protein Ratio |
Displays the most updated fat/protein ratio value:
|
|
DIM (Day in Milking) |
Displays the number of days since calving. |
Accessing the Fat/Protein Graph
The Fat/protein Graph is accessed via the Folder List in the Dashboard.
To view the Fat/Protein graph:
-
On the ABC Dashboard, open the Folder List.

-
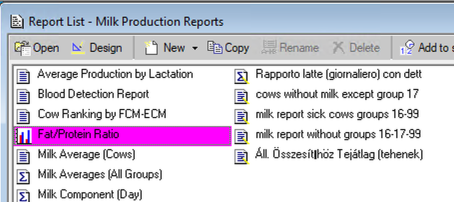
Expand the Milk Production folder, and then click Milk Production Reports.
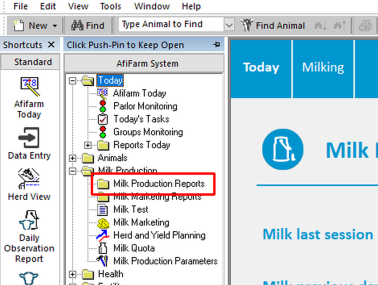
-
Click Fat/Protein Ratio.
Adjust the Graph's Display
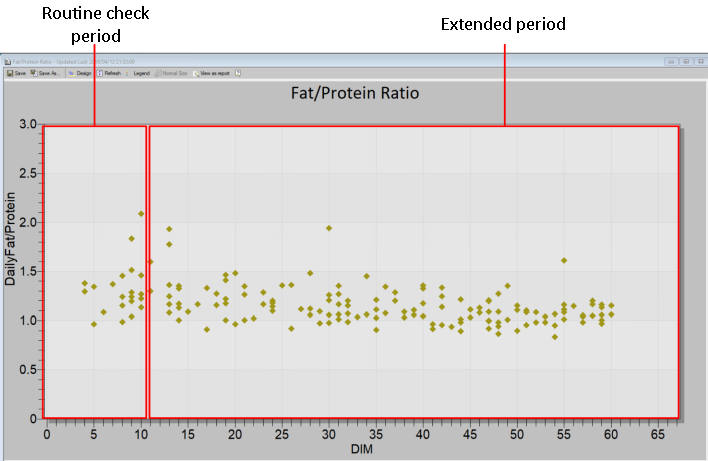
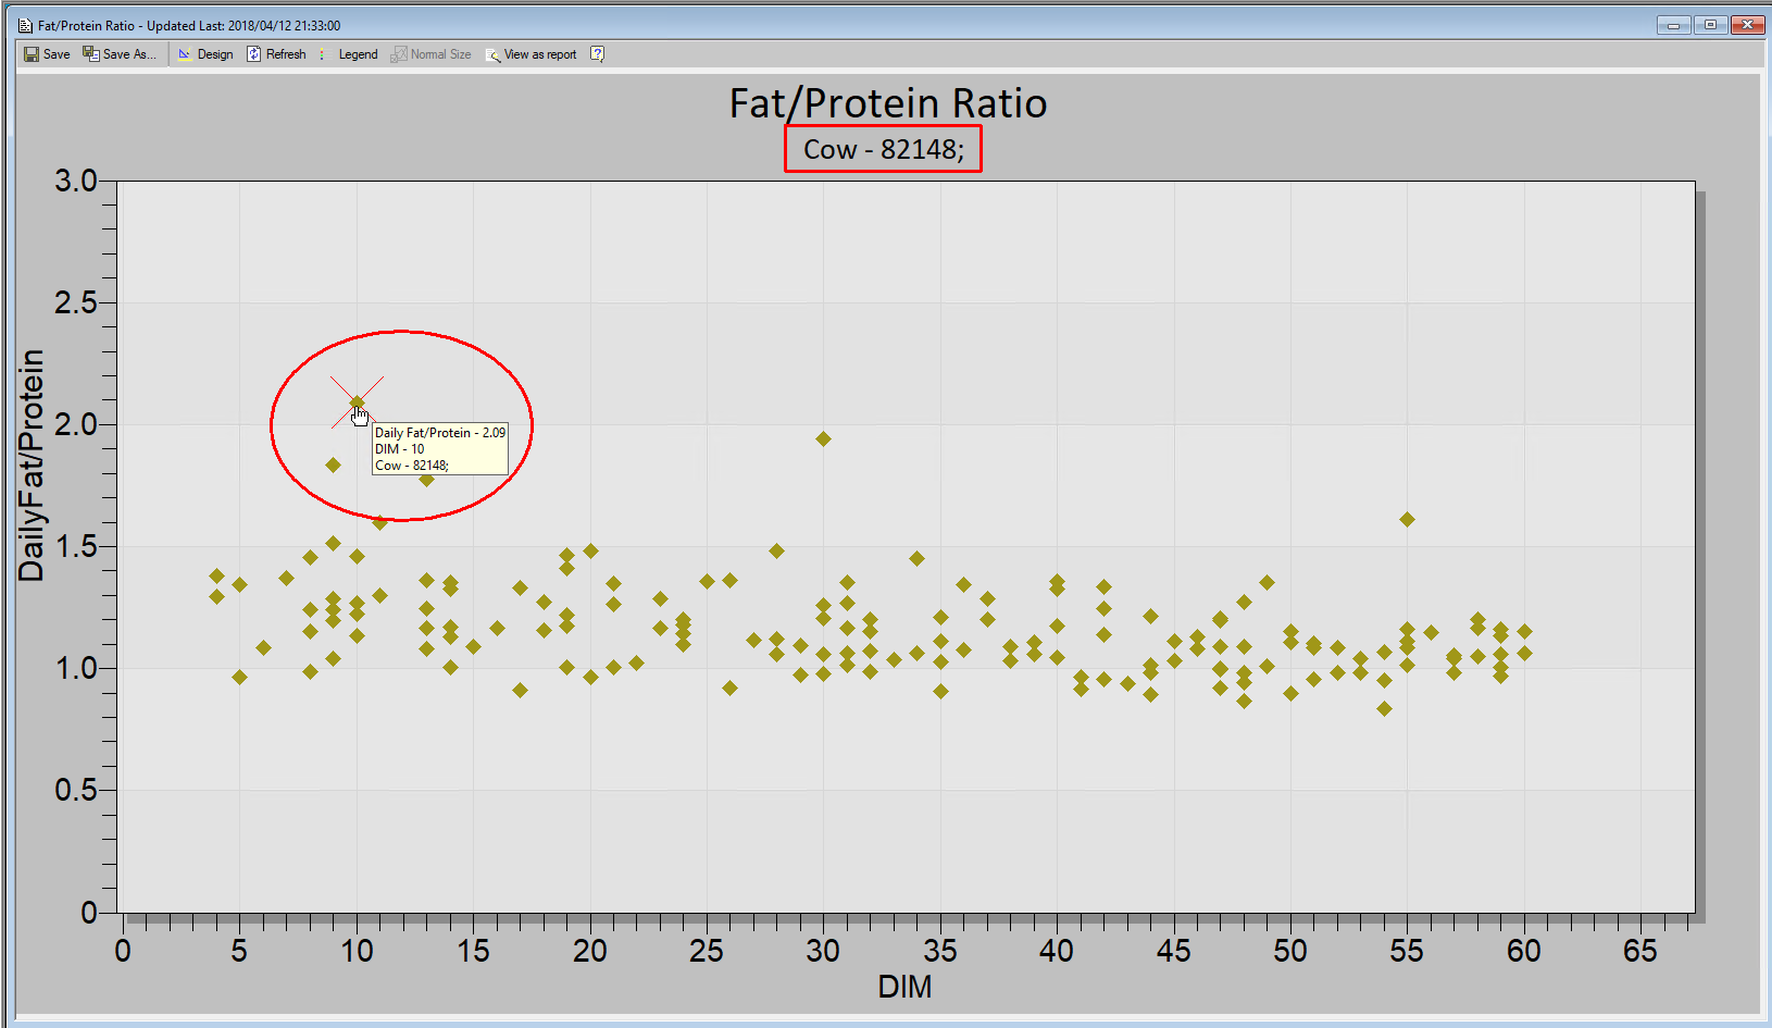
By default, the graph opens to display the last 450 DIM for the herd. Access the Design screen to define the number of DIM to view and zoom in to a specific view. You can also select one or more cows in the graph and add actions to them.
To change the graph view:
-
Click Design.

-
In the DIM row, in the To: column, change the value (for example to '60' to zoom in fresh cows period).
-
Click OK.
Note: You can also zoom into a specific period on the graph by highlighting that section.
-
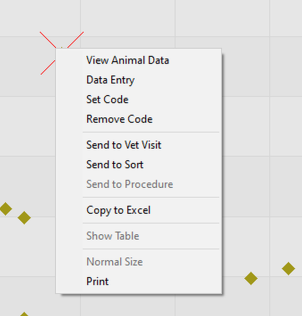
Identify and select cows in graph: Click on outstanding points to display the cow numbers they represent.
-
Once the cow is marked, right-click to select one of the following options from a menu:
-
Open Animal data sheet.
-
Send the cow to sort or vet visit.
-
Mark the cow with a code.