New York State Cattle Health Assurance Program
Veterinary Resource
Diagnosis of clinical mastitis is based on the appearance of abnormally appearing milk. Milk may be off color, watery, bloody or have the appearance of serum. Abnormal milk may also contain varying amounts of puss and clots. The amount of swelling, severity of pain and the overall appearance of the cow will indicate the severity of infection and serve as a guide for the course of treatment.
Diagnosis of subclinical infection is more problematic since the milk appears normal but usually has an elevated somatic cell count. Diagnosis of subclinical mastitis can be made in a variety of ways including direct measurement of the somatic cell count (SCC) level or indirectly by performing a California Mastitis Test (CMT) on suspected quarters. Milk culture of suspected quarters or cows (composite samples) will identify the presence of mastitis pathogens but will not provide a measure of the degree of inflammation associated with the infection. Individual cow SCC will provide a determination of the level of infection within the herd. Bulk tank somatic cell counts (BTSCC) are performed routinely as a indication of milk quality but the BTSCC can be used to monitor the level of udder health when the bulk tank scores are monitored over time.
Milk cultures of clinical quarters, fresh cows, high SCC, chronic infections or the entire herd will also provide a wealth of information concerning udder health and provides a basis for attacking the problem. Combining data from milk cultures and SCC information provides you with a herd inventory of mastitis pathogens, a picture of their distribution and an indication of the relative importance of each pathogen within the herd. This information can be used to identify risk factors and critical control points for control program development. It will also serve as a guide for developing realistic short and long term milk quality goals and provide the means for monitoring progress towards those goals.
Cow Side Testing
The California Mastitis Test (CMT)
The California Mastitis Test is a simple, inexpensive, rapid screening test for mastitis. The test is based upon the amount of cellular nuclear protein present in the milk sample. Since inflammatory cells associated with mastitis are the predominant cell type present in milk the CMT reflects the SCC level quite accurately and is a reliable indicator of the severity of infection. The test is appropriate for cow-side evaluation of udder health and the procedure can be taught quickly to producers and the milking crew. With proper training test results are very repeatable among those conducting the test. It is necessary that producers also be made aware of the limitations of the CMT and the proper application of management decisions based on CMT results.
The CMT can also be used to evaluate composite milk samples as well as bulk tank milk. Test criteria for commingled milk are less severe than that for quarter samples because of the dilution effect of milk from normal quarters or cows. The appropriateness or value of CMT evaluation of bulk milk decreases as herd size increases.
Table 1. Correlates CMT score with SCC level. CMT score N equates with SCC level of 200,000 cell/ml or less which is considered to be the physiological level for milk from uninfected cows. CMT Score T (trace) corresponds to a SCC level of 200,000 to 300,000 cells; the level at which infection is more likely and at which mastitis pathogens are likely to be isolated.
Table 1. Relationship between CMT Score and Somatic cell counts
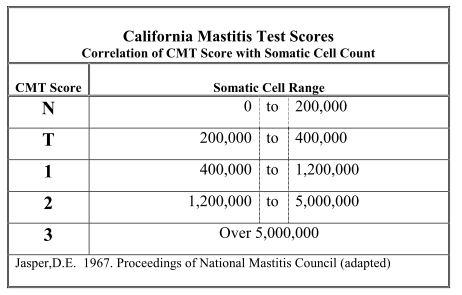
The CMT has a number of practical uses. In a crisis situation where a herd is at risk of losing it market or quality premiums the test can be used to screen animals or quarters to withhold from the bulk tank. More common and routine uses include screening of suspected new mastitis infections, and animal’s quarters to be sampled for SCC determination of bacterial culture. In many herds the test is used to screen fresh cows and cows at dry off. This information is useful for selecting cows for further evaluation (milk culture), culling, selective dry cow treatment or extended therapy. It is important that producers understand that a certain percent (10-20%) of cows sampled for bacterial culture based on CMT score will have no growth. This is due to a number of factors including short lived infections that have been cleared by the cow or infections that are characterized by intermittent shedding of bacteria (Strep ag, Staph aureus, mycoplasma).
It is not recommended that CMT results alone be used for immediate treatment unless the specific pathogen is known or is performed in accordance with a treatment protocol recommended by a veterinarian. Several studies have indicated that blitz therapy without prior knowledge of the pathogens present is uneconomical. This is due to the prevalence of resistant 3 infections such as Staphylococcus aureus, mycoplasma and many environmental infections that respond poorly to treatment during lactation.
The CMT can be used to monitor udder health trends over time. Recording individual cow scores on a monthly basis can be a very effective monitoring system that is particularly appropriate for smaller herds that do not participate in DHI SCC programs. When performed routinely and consistently over time the information can be used to analyze herd trends and individual cow udder health. A general goal is <15% CMT2 or greater.
Electrical Conductivity
Mastitic milk has a higher electrical conductivity than normal milk. This is due to tissue damage and the subsequent increase in Sodium and Chloride ions in milk. Conductivity sensors are being incorporated in many new automated milking systems. The change in electrical conductivity is one of the earliest manifestations associated with new infections making the early detection and recording of possible mastitis cases routine. The greatest problem associated with this new technology is the sensitivity and specificity of electrical conductivity between herds.
Recent advances in determining herd specific conductivity threshold levels have increased the value of this screening method in many herds. Milk conductivity is a screening test. A positive indication of increased electrical conductivity in a specific animal is an indication for further evaluation of that animal (temperature, udder examination, etc.) and not generally a signal for immediate treatment. Hand held conductivity meters are also available and may be useful for routine screening animals premilking.
Laboratory Tests
Bulk tank Somatic cell counts (BTSCC)
Bulk tank somatic cell counts (BTSCC) are reported to dairy producers on a routine basis (usually bimonthly) by milk buyers as a measure of milk quality. BTSCC scores can also be used to monitor the level of udder health.
In general BTSCC less than 200,000 cells/ml indicate a minimal level of infection, however a series of BTSCC’s over 500,000 cells/ml indicate a problem with subclinical or chronic infection. Because the BTSCC is a function of both the quarter infection rate and the severity of infections, attempts to predict the infection status from a single BTSCC are usually unsuccessful.
This is particularly true for small herds where an elevated tank count may be the result of exceptionally high counts in a few cows or from a general elevation of counts from many cows.
When interpreting BTSCC results it must be remembered that milk the milk is a commingled from many cows and is affected by many factors. The most important factor affecting BTSCC is infection status or herd prevalence. The predominant pathogens also have a profound effect on BTSCC. Strep ag infection usually produced higher cell counts than does Staph aureus. Minor pathogens such as coagulase-negative Staphylococcus and Corynebacterium bovis have an even smaller effect on SCC. Cell counts also increase with age on a herd basis. This is not an age-related factor but is a result of increased prevalence of infection associated with increasing age.
Summer months are often associated with increased SCC levels. This seasonal increase may be associated with heat stress and an increase in infection rate associated with environmental pathogens. It may also be physiological. This phenomenon is not completely understood. In seasonal calving herds elevated SCC in very early lactation can be a problem although usually short lived. However, elevated BTSCC are a more common problem in late lactation in seasonal herds as well as herds or groups with excessively high average days in milk. This again is usually due to an increase prevalence of infection associated with advancing lactation.
A common complaint of some dairy producers on official test is that calculated Test Day herd SCC average does not always agree with measured BTSCC. There are several possible reasons for this including:
- The somatic cells are not uniformly distributed in the bulk tank (inadequate agitation prior to sampling allows the somatic cells to remain in the fat layer).
- The somatic cell count of individual cows varies from milking to milking and day to day.
- Diurnal variation in SCC can and does occur.
- Errors in laboratory methods.
- Errors in milk weight recording
- Cows that was milked but unaccounted for.
- The coefficients of variation for BTSCC have been report to be 23- 24%.
Individual Cow Somatic Cell Counts (SCC)
The most important factor affecting the SCC of milk from a quarter, cow or herd is the infection status of the quarter. Various authors have reported average SCC for uninfected quarters to be 170,000 to 214,000 cells/ml or a geometric mean of 106,000 cells/ml. Somatic cell response of infected cows will depend somewhat on the pathogen present. Minor pathogens such as C. bovis and coagulase-negative Staphylococcus average 227,000 cells/ml when all age groups are considered. Animals infected with major pathogens (Streptococcus agalactiae, Staphylococcus aureus, Environmental Streptococci) produce average counts greater than 600,000 cells/ml.
Individual cow somatic cell counts are the product of the SCC measurement of all milk from all four quarters and the level of production of the individual quarters. The number of infected quarters as well as the total milk production become important factors in being able to accurately classify a cow as infected by means of SCC. The dilution effect of normal milk can mask infection. Researchers in Canada have found that the ability to correctly classify cows as infected or uninfected by SCC increased from 77.9% to 92.7% as the number of infected quarters rose from one to four quarters.
The SCC from individual cows can span a very wide range of values. To classify a cow as infected or not infected by means of SCC alone an appropriate threshold level must be chosen. This threshold level will vary from herd to herd. Regardless of the level chosen some infected and uninfected quarters will be misclassified. Chances of isolating a major pathogen increase when quarter SCC’s are above 200,000cells/ml. SCC’s of composite quarters have shown that a threshold value of approximately 250,000 cells/ml is reasonable for differentiating infected from 5 noninfected quarters. A threshold of 228,000 cells has been show to correctly classify more then 85% of cows.
Linear Score
Official test scores of somatic cell counts are typically reported as Log linear scores of the raw SCC. Log linear scores provide a more accurate and direct measure of milk losses associated with increasing SCC as demonstrated in the table below. An increase in 1 Linear Score unit equals a loss of 1.5 pounds of milk per cow per day or 400 pounds per lactation (the loss for first lactation animals is half that amount). The raw SCC can be deceiving when trying to relate milk loss relative to SCC since the milk loss is much greater at lower counts than higher counts.
Monthly variations in Linear Score (LS) of individual cows is small making LS measure of SCC more repeatable than the raw score. The average LS give a less distorted and more accurate picture of a lactation than does the average raw SCC. For these reasons LS is used most frequently when analyzing and graphing SCC data.
Table 2. Relationship between SCC Linear Score (LS), Somatic Cell Count and Estimated Daily Milk Losses

Shook G. & A. Seaman. 1983. JDS 39 (12)
Milk Cultures
Culturing milk from the bulk tank, individual quarter or cow, groups or categories of cows adds an additional dimension to evaluating udder health and mastitis control programs especially when that information is combined with SCC or clinical mastitis data. This information not only 6 provides a snap-shot in time of the udder health situation of a herd it provides a very effective means of plotting of identifying infection trends, identifying herd risk factors and monitoring herd performance and management interventions. Routine milk cultures should be an ongoing part of any mastitis control program. The sampling strategies for any ongoing program require the input of the herd veterinarian as well as herd management. It is particularly important that milkers be aware of any standard procedures for identifying cows to sample as well as appropriate sampling procedures.
Bulk Milk Cultures
Sampling the bulk tank milk (BTC) is a simple, inexpensive means of determining the presence of mastitis pathogens in a herd. This culturing method does have its limitations and is best suited for the identification of contagious mastitis pathogens and for monitoring the presence of pathogens over time. In no way does the presence of a pathogen or the relative numbers of a specific pathogen present on the plate indicate the prevalence of infection within the herd. Bulk tank culture results not only reflect the mastitis pathogens present in a herd but also identify those organisms may contaminate milk from the teats of cows milking environment or milking equipment. For that reason BTC can also be used to evaluate milk quality, milking methods and procedures and overall level of hygiene of milk collection and storage on the farm. These testing methods are included elsewhere in the NYSCHAP Mastitis Module.
Figure 1. Probability of detection of a pathogen with repeated sampling. The sensitivity of an individual test is presented in the different lines in the graph.

The numbers of mastitis pathogens present in milk will be dependent upon a number of factors including the specific pathogen involved, the prevalence of infection within the herd and the numbers of organisms being shed at that moment by infected animals. These factors determine test sensitivity for BTC or the ability of bulk tank culture to correctly identify the presence of infection by specific pathogens in a herd at a give point in time. Test sensitivity varies by pathogen. QMPS data indicate test sensitivities for a single bulk tank sample of 90%, 75% and 50% respectively for Streptococcus agalactiae, Staphylococcus aureus and Mycoplasma spp. respectively. Herd or group size may also be an issue due to the dilution factor of large cow numbers. BTC from herds with a low prevalence of infection with a specific organism, especially contagious pathogens (Staphylococcus aureus, Streptococcus agalactiae, and Mycoplasma spp.) may not always indicate the presence of those pathogens. Therefore BTC results should always be considered when collected as a series of tests over a given period of time. This is absolutely necessary when monitoring the progress of existing pathogen elimination programs or when screening herds or groups of animals as part of a prepurchase screening program. The sampling interval should be based on herd dynamics. Generally BTC for monitoring open herds should be bimonthly or monthly. When screening animals for purchase three bulk tank samples over a one-week period is most often recommended. Figure 1. clearly demonstrates the influence of sampling frequency and test specificity on the probability of detection of a specific pathogen in a bulk tank milk sample.
Individual Cow Samples
Individual animal cultures provide another method of diagnosing mastitis. Cultures alone provide an indication of the possible pathogen involved. However the possibility of a false positive result due to contamination of the sample with organisms present in the teat canal, teat skin or environmental contamination of the sample will affect test specificity. Infected animal not currently shedding pathogens may have a negative culture result hereby affecting test sensitivity. Test sensitivity and specificity are about 70% for single cultures. When multiple samples of the same animal are take sensitivity remains about the same however test specificity increases to 80 – 90 %. These results are species specific.
Individual cow culture results become much more meaningful when combined with SCC results. Using SCC to select cows to be sampled for milk culture (animals at higher risk for infection) ensures a relatively good predictive value for the culture results. Using two tests simultaneously to evaluate animals will increase the sensitivity but decrease the specificity (slightly) the combined tests. Predictive value (PV) of a test is defined as the proportion of infected animals among those that are test positive. It is important be because it reflects the way tests are used and interpreted in the field. The predictive value of any given test is a function of the test specificity, sensitivity as well as the prevalence of the disease in the herd. The predictive value of a test decreases as the prevalence of the disease decreases within the herd. When applied to SCC and milk cultures the specificity of culture results improves as the SCC threshold increases. In most herd investigations using an LS of 4.0 (SCC = 200,000 cells) provides approximately 70 to 80 % sensitivity and specificity.
Sampling Methods – Herd Survey
The proper sampling method to employ when faced with a herd problem should be determined the history of the herd and the urgency of the situation. Herds with a history characteristic of contagious mastitis such as a steady rise in BTSCC or those highly suspect of having contagious mastitis may benefit from an initial bulk tank culture. Those herds in imminent danger of losing 8 their market are likely to benefit most from a herd survey. Any herd known to have contagious mastitis (Staphylococcus aureus, Streptococcus agalactiae or Mycoplasma spp.) and a desire to eliminate the infection from the herd must have a whole herd survey. A whole herd survey provides an estimate of infection prevalence or an inventory of mastitis pathogens in a herd. A single survey provides an excellent estimation of the herd prevalence rate of specific pathogens.
In addition it provides an excellent graphic of the distribution or epidemiologic patterns of infection within the herd. Table 3. provides a clear illustration of the herd prevalence information provided by whole herd surveys in a successful effort to eliminate Strep ag from a herd.
Table 3. This table illustrates the inventory of pathogens that typically identified from herd surveys.

The initial survey identified Strep ag as a major problem. Management chose to eliminate the infection from the herd and was very compliant with recommendation to contain and treat existing infections. The herd was surveyed every 4 to 5 weeks. However recommendations to control environmental infection were largely ignored.
When elimination of a contagious pathogen such as Strep ag becomes a herd goal frequent herd surveys become necessary. Success of such a program is heavily dependent upon accurate identification of infected animals so that infection can be contained by means of segregation of infected animals at milking time as well as effective treatment of the infected animals. Since microbiological culture of individual milk samples has a test sensitivity less than 100% false negative culture results do occur. Selection of animals for culture by means of SCC will also result in the misidentification of infected animals. Of course new infections may have occurred during the time interval between sampling and implementation of a control program. Therefore a whole herd survey is necessary soon after treatment period has passed so that infected animals can be identified. A delay in the time interval between surveys will allow the infection to spread, hindering the eradication process and increasing the associated costs. These same principles apply to other contagious pathogens such as Staphylococcus aureus and Mycoplasma spp. although mycoplasma and Staph aureus infections are more problematic. Mycoplasma infections are, at this time, considered untreatable. Infected cows can remain infected for life, become intermittent shedders and are a constant source of new infections. Culling infected cows provides the most effective means of infection control. Staph aureus infection is also very difficult to cure. This is particularly true for treatment during lactation. Treatment at dry off offers a greater opportunity to eliminate infections but Staph aureus infection too frequently carry through to the next lactation.
Herd surveys can be valuable when investigating problem herds characterized primarily by environmental infections. When this information is used in conjunction with individual cow SCC reports the impact of specific pathogens can be ascertained. When combined with monthly production and SCC scores a wealth of knowledge becomes available.
Producers with relatively low levels of infection or low BTSCC will also benefit from milk cultures of problem animals. Milk cultures based on stage of lactation or history can provide valuable information concerning pathogen prevalence, monitoring the effectiveness of control programs or treatment protocols and is used to identify risk factors for new infection. For example, the dry period is a known risk factor for new infections by environmental pathogens.
Environmental Streptococci and coliform infections are 2 to 12 time more likely to occur during the dry period than lactation. To provide a better understanding of the new infection rate during the dry period a producer could use LS1 (first LS after freshening) to select cows for sampling and possible treatment. A producer not taking advantage of DHI test data could use CMT results to reach similar conclusions. A similar testing method can be used to samples cows at dry off to identify infected cows (quarters), evaluate the effectiveness of dry cow treatment or use selective dry cow therapy.
Culturing clinical quarters can provide valuable information concerning pathogen prevalence and provide a more logical means of selecting appropriate treatment protocols. When used in conjunction with SCC and other production parameters the data can provide valuable insight for identifying risk factors such as stage of lactation, low SCC, parity, or production group and provide a basis for evaluating the effectiveness of vaccination programs or treatment methods.
Other categories of animals that may benefit from sampling and culture include chronic infections and high cell count animals.
Use of DHI Somatic Cell Counts to Diagnose and Monitor Udder Health and Milk Quality
Using computerized herd record analysis programs such as Dairy Comp 305 allows management to be more proactive in dealing with udder health and milk quality issues. Routine monitoring of this information can quickly alert producers and their veterinarians to potential problem areas.
Monitoring can also serve as a motivational tool and marketing device for quality milk technical services.
Quality Milk Promotion Services has developed a menu of reports for Dairy Comp 305 that simplifies the visualization and analysis of individual and herd udder health. It is also possible to incorporate whole herd culture results with relative ease. These reports allow you to look at a variety of parameters including:
- Linear score over time
- Linear score by pathogen
- Linear score at freshening and dry off
- Maximum linear score
- Linear score by parity, production group or DIM
Producers who enter other disease and health data into Dairy Comp can also evaluate the incidence and prevalence of clinical mastitis the possible interaction other health problems such as metabolic disease, DA, retained placenta etc with udder health. Some commands for reports helpful in evaluating herd data or selecting individuals for further action are listed below. For a complete list of commands or a copy of the QMPS BASIS menu please contact QMPS lab in Ithaca.
List high cell count cows.
LIST ID LACT DIM LS1 PLS4 PLS3 PLS LS AVLS NMAST FOR LS>4
Summary of Linear score by parity.
SUM LS PLS AVLS LS1 FOR SCC>0 BY LACTGP\F
Summary of linear score by Days in Milk
SUM LS PLS AVLS LS1DRYLS FOR SCC>0 BY DIMGP\F
Graph of current linear score vs previous linear score
GRAPH LS VS PLS
Graph of linear score at dry off vs linear score at calving
GRAPH DRYLS VS LS1
SCC list with culture results
LIST ID LACT DIM DRYLS LS1 PLS4 PLS3 PLS LS AVLS RCULT FOR LACT>0
Summary of mastitis events by lactation
SUM BY LACT FOR NMAST>0 11
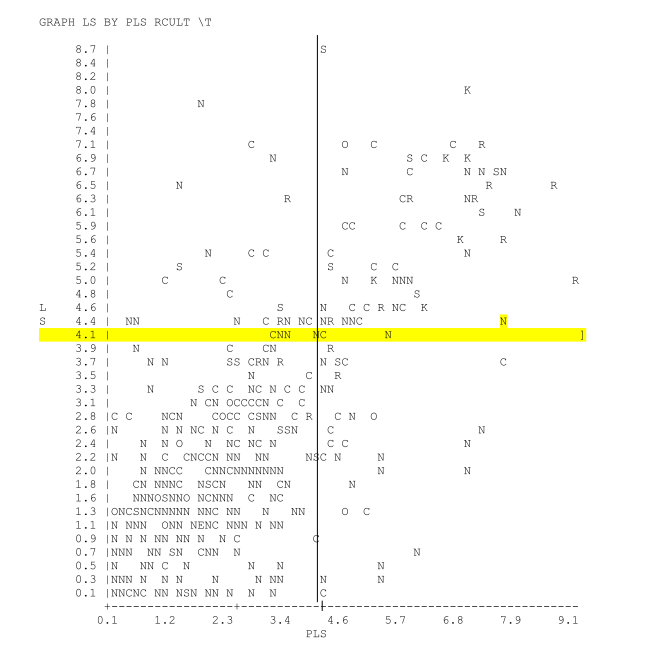
This graph of current linear score vs previous linear score by culture result. The upper left quadrant represents new infections (low previous LS current high LS). The upper right quadrant represents chronic infections (LS >4.0 and PLS > 4.0). The lower right quadrant represents cured infections (LS < 4.0, PLS >4.0). The lower left quadrant represents no infection (by LS parameters). The letters designate culture result. ie. N= negative; R= Staph aureus; S = Strepspp; C = CNS Staph; K = Klebsiella.
Selecting a specific letter on the graph will display the specific animal history.
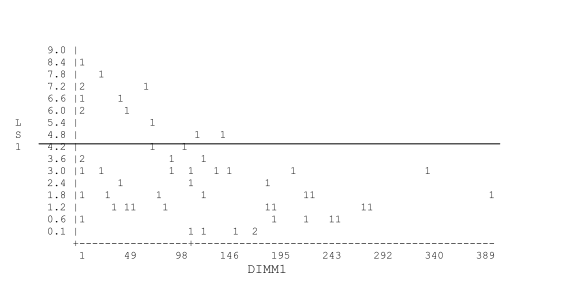
This is a graph of LS1 (first linear score after calving) by Days in milk at first mastitis (DIM at the time if the first clinical case of mastitis). The graph demonstrates the association between a high linear score at calving and clinical mastitis. This particular herd has a BTSCC below but an increase in subclinical infections was causing the BTSCC to increase gradually. Part of the problem was an increase in new infections associated with environmental conditions during the dry period.
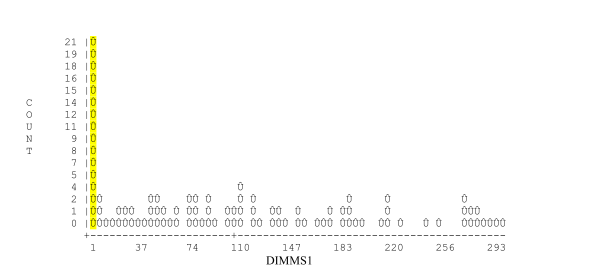
This graph plots days in milk at first clinical mastitis. In order generate this graph it is necessary to enter clinical mastitis events in the computer. This graph demonstrates the high level of clinical mastitis seen at or shortly after calving but also shows additional peaks of clinical mastitis in mid and late lactation.
