How much milk do your cows produce in the first minute of milking?
- How does your milk yield compare to other farms’?
- How long does an average milking session last in your parlor?
- Do you know if this is the optimum length of time according to the research?
If you know the answers to the above questions, you’re well on your way to running a super-efficient dairy farm. That’s because comparing your farm’s milking performance to scientifically-researched industry standards is one of the best ways to make sure you’re on track for maximum profitability.
According to agricultural research, the most efficient farms produce 50% or more of their total milk volume per session within the first two minutes of milking. If you track this data and find your farm falling short, you’ll know exactly where to concentrate your efforts for better outcomes and more profit. By monitoring parlor performance across several variables, you’ll quickly learn how your farm stacks up against the industry standards and be in a position to address any problem areas. The key is in the data and fortunately, it’s not as hard to track this type of data as you might think.
Tools such as Afifarm’s MPC use sensors to collect several data points from the parlor floor during milking time. Data is then transmitted to the Milking Efficiency software where you can use it to gain deep insights into your farm’s performance.
Generating A Milking Report
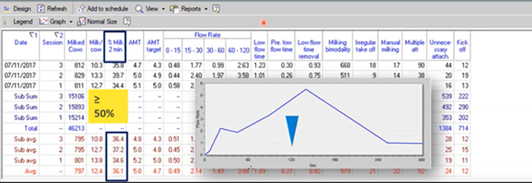
In part two of this series, you saw that one of the outputs of the Milking Efficiency Module is the “milk flow graph” (shown below). This graphical representation of the milking process allows farmers to spot inefficiencies and problems at a glance.
But the milk curve is just the tip of the iceberg. The milking efficiency module collects detailed data on several data points which provide you with a complete picture of what’s really happening on your farm.
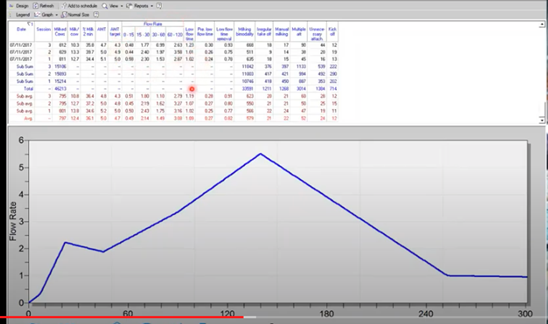
Within the Afifarm software, it’s simple to generate a report on any milking session or time period. Generally speaking, it is more informative to generate a report that covers at least a twenty-day period. This is because isolated factors can cause bad results on one day but do not indicate pervasive problems with the milking protocol. For example, a milker who is having a “bad day” could be rough when connecting cows to the milking clusters (it happens). The resulting stress could lead to a one-off poor yield. For the best insights, it is therefore recommended to generate a report from a longer period of time.
In the report below, which was generated from multiple milking sessions, each row represents milking session.
Performance Measures You Can Track With The Milk Efficiency Module
The following 10 key performance indicators (KPIs) are easy to track using the Afimilk MPC. Compare your results on these KPIs to industry standards and you’ll gain a complete picture of what’s going right and what’s going wrong in your parlor.
Remember, knowledge is power. Understanding where you are falling short is half the battle and makes fixing the problem that much easier.
ONE – % Milk Output In The First 2 Mins
This is a critical KPI and a point at which many farms fall down. The goal of the efficient farm is to extract as much milk as possible in the shortest amount of time and in order to do that, the first two minutes of milking are critical. To comply with the industry standard, at least 50% of the total milk produced should be harvested in the first two minutes (or less) of each miking.
TWO – AMT (Actual Milking Time)
The time that cows spend attached to the milking machine is critical to their health. Over-milked cows suffer excess heat and damage to their udders and end up with more frequent attacks of mastitis and other bacterial infections.
The gold standard milking time is below 4.5 mins.
THREE – Flow Rate
You can see accurate milk flow data covering the first 2 minutes of milking in 15-second intervals. This will allow you to hone in on exactly the point where a problem is occurring and investigate why. The chart below displays the industry gold standards for each time interval.
Milk Flow Gold Standard by Interval
FOUR – Low Flow Time
The system measures pre-low flow time (at the beginning of milking) and low flow time at removal. Industry standards show that, for optimal results, the milking machine should be detached at the point where milk flow falls below 1kg per minute. Failure to do this could lead to teat damage and infection.
Poor flow times are generally due to a milker canceling automatic takeoff and switching to manual operation or to a mistake in the original setting in the control panel that determines when automatic take-off happens. Once you spot the problem, you just have to find out what caused it and you can be back on track.
FIVE – Milking Bimodality
Bimodality refers to a phenomenon where milk flow begins and then suddenly ceases, then begins again. This is a common and undesirable problem on dairy farms which indicates that the machine massaged the teat in an attempt to extract milk but could not get any milk to flow. This is a serious problem because of the damage that happens to the delicate teats when they are over-massaged with no milk flowing.
Industry standards dictate that no more than 30% of the cows in a sample should show bimodality.
SIX – Irregular Take-off
This indicates that a milker manually removed the milking machine rather than waiting for an automatic take-off mechanism to determine the end of the milking time. (See industry-standard chart below*.)
SEVEN – Manual Milking
This shows that someone manually canceled the automatic take-off mechanism at the start of milking. Once canceled, it cannot be reinstated in that session. (See industry-standard chart below*.)
EIGHT – Multiple ATT
ATT refers to multiple attachments. It means that one of the milkers removed the milking machine from the cow and then reattached it later in the session. (See industry-standard chart below*.)
NINE – Unnecessary Attachment
In cases where multiple attachments took place, the MPC measures how much milk was harvested in the additional attachment period. If less than one kilogram of milk is harvested, it is considered to have been an unnecessary reattachment. (See industry-standard chart below*.)
TEN – Kick-off
This refers to instances where the milking machine was removed at a time when the flow rate was higher than one kilogram per minute and was neither manually removed nor the result of the automatic take-off mechanism. Such an event can occur when cows are irritated by something in the environment (e.g. flies, voltage issues) and kick off the machine in frustration. It can also be a sign of another problem. Mass instances of kick-off over time are a signal to investigate what’s going on. (See industry-standard chart below*.)
Over to you
The data gathered by the milking efficiency module gives you a detailed insight into what’s happening daily in your milking parlor. Armed with this knowledge, you can quickly detect problems and understand if they are a one-off occurrence or part of a more pervasive issue with the milking protocol itself. You can’t fix what you don’t know and this tool makes sure that farmers receive the data they need to plan to run the most efficient milk parlor possible.
*Industry Standards for KPIs 6-10
The industry standards for irregular take-off, manual milking, multiple att, unnecessary attachment, and kick-off are shown below. As you can see, if any of these events occur more than 5% of the time, it is bad. Between 3 and 5% is acceptable, and under 3% is excellent:
